Use features in the Connected Factory solution accelerator dashboard
Important
While we update this article, see Azure Industrial IoT for the most up to date content.
The Deploy a cloud-based solution to manage my industrial IoT devices quickstart showed you how to navigate the dashboard and respond to alarms. This how-to guide shows you some additional dashboard features you can use to monitor and manage your industrial IoT devices.
Apply filters
You can filter the information displayed on the dashboard either in the Factory Locations panel or the Alarms panel:
Click the funnel icon to display a list of available filters in either the factory locations panel or the alarms panel.
The filters panel is displayed:
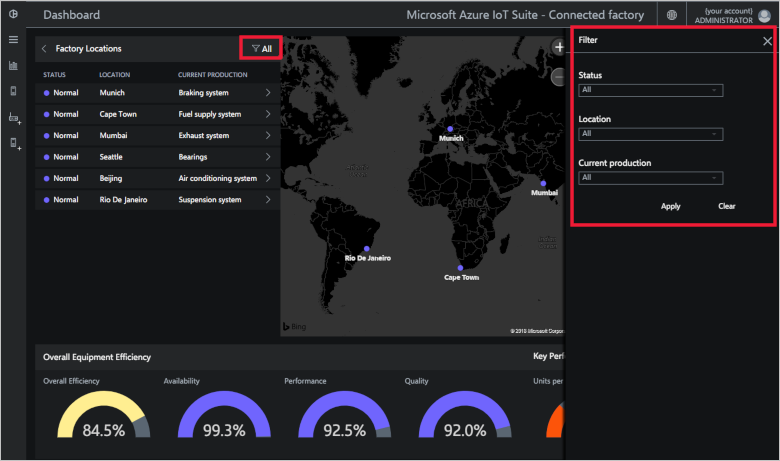
Choose the filter that you require and click Apply. It's also possible to type free text into the filter fields.
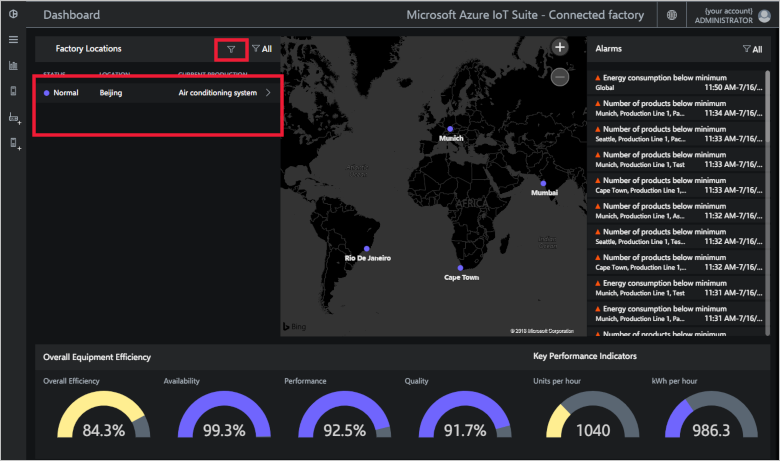
The filter is then applied. The extra funnel icon indicates that a filter is applied:
Note
An active filter doesn't affect the displayed OEE and KPI values, it only filters the list contents.
To clear a filter, click the funnel and click Clear in the filter panel.


Browse an OPC UA server
When you deploy the solution accelerator, you automatically provision a set of simulated OPC UA servers that you can browse from the dashboard. Simulated servers make it easy for you to experiment with the solution accelerator without the need to deploy real servers.
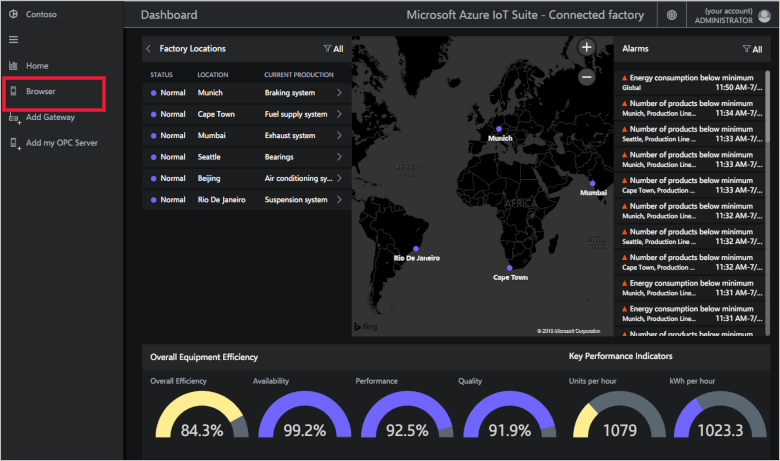
Click the browser icon in the dashboard navigation bar:
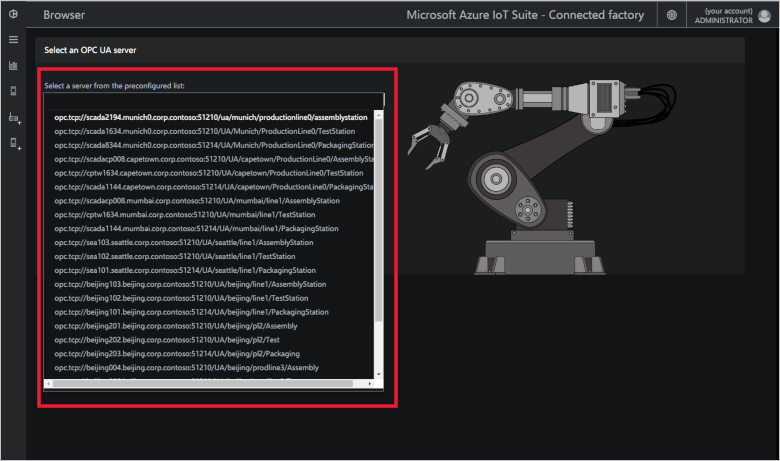
Choose one of the servers from the list that shows the servers deployed for you in the solution accelerator:
Click Connect, a security dialog displays. For the simulation, it's safe to click Proceed.
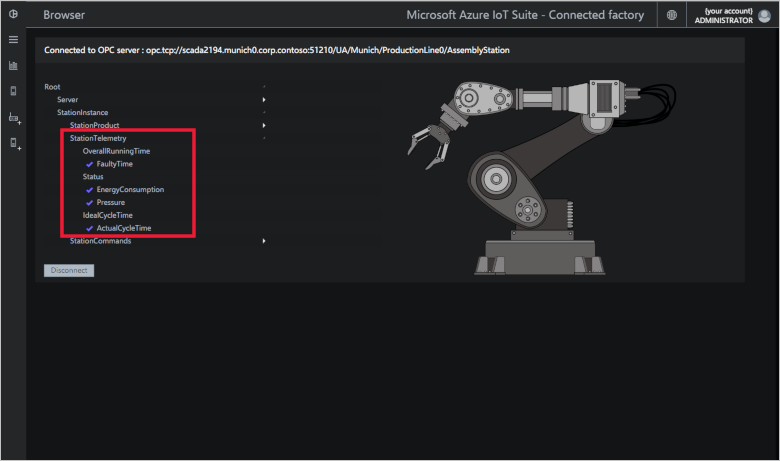
To expand any of the nodes in the server tree, click it. Nodes that are publishing telemetry have a check mark beside them:
Right-click an item to read, write, publish, or call that node. The actions available to you depend on your permissions and the attributes of the node. The read option displays a context panel showing the value of the specific node. The write option displays a context panel where you can enter a new value. The call option displays a node where you can enter the parameters for the call.


Publish a node
When you browse a simulated OPC UA server, you can also choose to publish new nodes. You can analyze the telemetry from these nodes in the solution. These simulated OPC UA servers make it easy to experiment with the solution accelerator without deploying real devices:
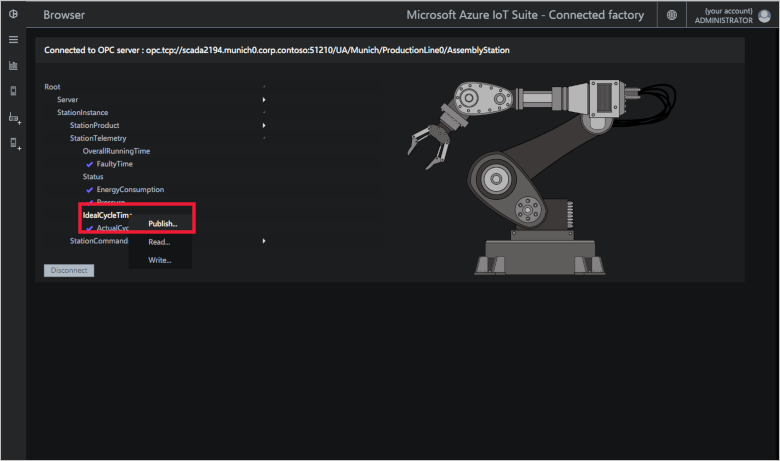
Browse to a node in the OPC UA server browser tree that you wish to publish.
Right-click the node. Click Publish:
A context panel appears which tells you that the publish has succeeded. The node appears in the station level view with a check mark beside it:


Command and control
The Connected Factory allows you command and control your industry devices directly from the cloud. You can use this feature to respond to alarms generated by the device. For example, you could send a command to the device to open a pressure release valve. You can find the available commands in the StationCommands node in the OPC UA servers browser tree. In this scenario, you open a pressure release valve on the assembly station of a production line in Munich. To use the command and control functionality, you must be in the Administrator role for the solution accelerator deployment:
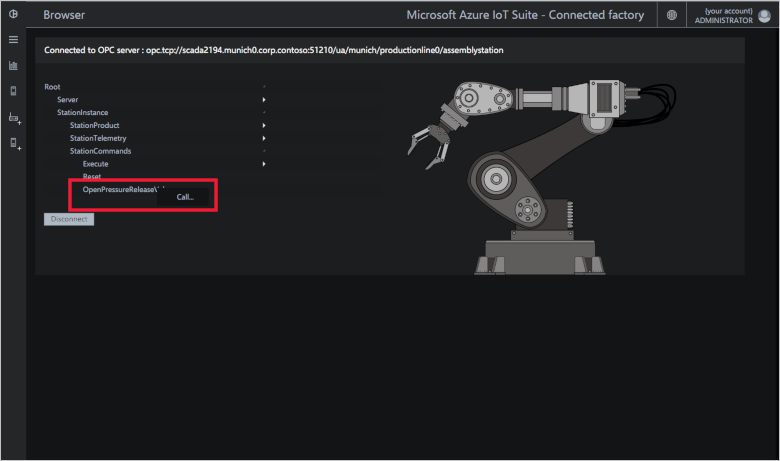
Browse to the StationCommands node in the OPC UA server browser tree for the Munich, production line 0, assembly station.
Choose the command that you wish use. Right-click the OpenPressureReleaseValve node. Click Call:
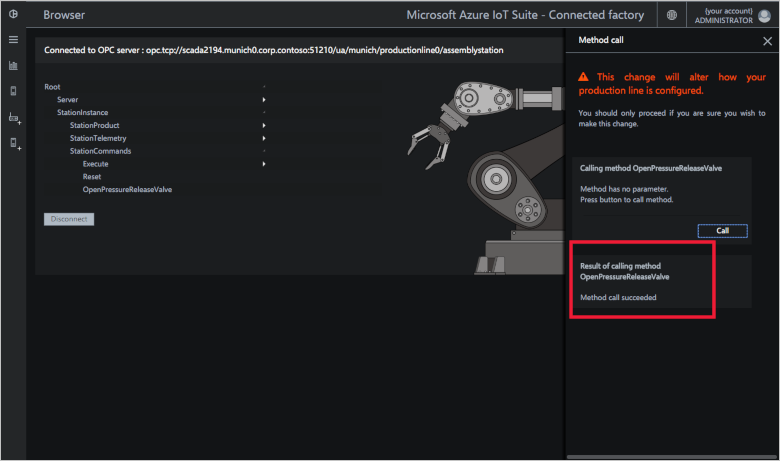
A context panel appears informing you which method you're about to call and any parameter details. Click Call:

The context panel is updated to inform you that the method call succeeded. You can verify the call succeeded by reading the value of the pressure node that updated as a result of the call.


Behind the scenes
When you deploy a solution accelerator, the deployment process creates multiple resources in the Azure subscription you selected. You can view these resources in the Azure portal. The deployment process creates a resource group with a name based on the name you choose for your solution accelerator:

You can view the settings of each resource by selecting it in the list of resources in the resource group.
You can also view the source code for the solution accelerator in the azure-iot-connected-factory GitHub repository.
When you're done, you can delete the solution accelerator from your Azure subscription on the azureiotsolutions.com site. This site enables you to easily delete all the resources that were provisioned when you created the solution accelerator.
Note
To ensure that you delete everything related to the solution accelerator, delete it on the azureiotsolutions.com site. Do not delete the resource group in the portal.
Next steps
Now that you’ve deployed a working solution accelerator, you can continue getting started with IoT solution accelerators by reading the following article: Configure the Connected Factory solution accelerator.