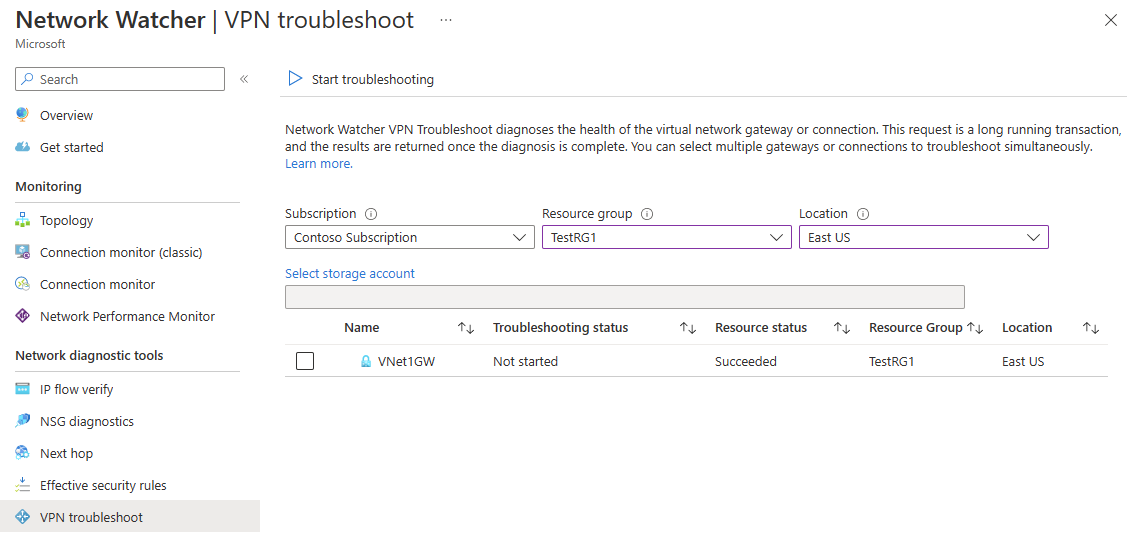
Virtual network gateways provide connectivity between on-premises resources and Azure Virtual Networks. Monitoring virtual network gateways and their connections are critical to ensure communication isn't broken. Azure Network Watcher VPN troubleshoot provides the capability to troubleshoot virtual network gateways and their connections. VPN troubleshoot can be called through the Azure portal, Azure PowerShell, Azure CLI, or REST API. When called, Network Watcher diagnoses the health of the gateway, or connection, and returns the appropriate results. The request is a long running transaction. The results are returned once the diagnosis is complete.
Supported Gateway types
The following table lists which gateways and connections are supported with Network Watcher troubleshooting:
Gateway or connection
Supported
Gateway types
VPN
Supported
ExpressRoute
Not Supported
VPN types
Route Based
Supported
Policy Based
Not Supported
Connection types
IPsec
Supported
VNet2VNet
Supported
ExpressRoute
Not Supported
VPNClient
Not Supported
Results
The preliminary results returned give an overall picture of the health of the resource. Deeper information can be provided for resources as shown in the following section:
The following list is the values returned by the VPN troubleshoot API:
startTime - This value is the time the troubleshoot API call started.
endTime - This value is the time when the troubleshooting ended.
code - This value is UnHealthy, if there's a single diagnosis failure.
results - Results is a collection of results returned on the Connection or the virtual network gateway.
id - This value is the fault type.
summary - This value is a summary of the fault.
detailed - This value provides a detailed description of the fault.
recommendedActions - This property is a collection of recommended actions to take.
actionText - This value contains the text describing what action to take.
actionUri - This value provides the URI to documentation on how to act.
actionUriText - This value is a short description of the action text.
The following tables show the different fault types (id under results from the preceding list) that are available and if the fault creates logs.
Gateway
Fault Type
Reason
Log
NoFault
When no error is detected
Yes
GatewayNotFound
Can't find gateway or gateway isn't provisioned
No
PlannedMaintenance
Gateway instance is under maintenance
No
UserDrivenUpdate
This fault occurs when a user update is in progress. The update could be a resize operation.
No
VipUnResponsive
This fault occurs when the primary instance of the gateway can't be reached due to a health probe failure.
No
PlatformInActive
There's an issue with the platform.
No
ServiceNotRunning
The underlying service isn't running.
No
NoConnectionsFoundForGateway
No connections exist on the gateway. This fault is only a warning.
No
ConnectionsNotConnected
Connections aren't connected. This fault is only a warning.
Yes
GatewayCPUUsageExceeded
The current gateway CPU usage is > 95%.
Yes
Connection
Fault Type
Reason
Log
NoFault
When no error is detected
Yes
GatewayNotFound
Can't find gateway or gateway isn't provisioned
No
PlannedMaintenance
Gateway instance is under maintenance
No
UserDrivenUpdate
This fault occurs when a user update is in progress. The update could be a resize operation.
No
VipUnResponsive
This fault occurs when the primary instance of the gateway can't be reached due to a health probe failure.
No
ConnectionEntityNotFound
Connection configuration is missing
No
ConnectionIsMarkedDisconnected
The connection is marked "disconnected"
No
ConnectionNotConfiguredOnGateway
The underlying service doesn't have the connection configured.
Yes
ConnectionMarkedStandby
The underlying service is marked as standby.
Yes
Authentication
Preshared key mismatch
Yes
PeerReachability
The peer gateway isn't reachable.
Yes
IkePolicyMismatch
The peer gateway has IKE policies that aren't supported by Azure.
Yes
WfpParse Error
An error occurred parsing the WFP log.
Yes
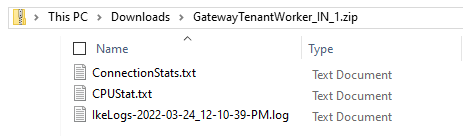
Log files
The resource troubleshooting log files are stored in a storage account after resource troubleshooting is finished. The following image shows the example contents of a call that resulted in an error.
Note
In some cases, only a subset of the logs files is written to storage.
For newer gateway versions, the IkeErrors.txt, Scrubbed-wfpdiag.txt and wfpdiag.txt.sum have been replaced by an IkeLogs.txt file that contains the whole IKE activity (not just errors).
The ConnectionStats.txt file contains overall stats of the Connection, including ingress and egress bytes, Connection status, and the time the Connection was established.
Note
If the call to the troubleshooting API returns healthy, the only thing returned in the zip file is a ConnectionStats.txt file.
The contents of this file are similar to the following example:
Connectivity State : Connected
Remote Tunnel Endpoint :
Ingress Bytes (since last connected) : 288 B
Egress Bytes (Since last connected) : 288 B
Connected Since : 2/1/2017 8:22:06 PM
CPUStats.txt
The CPUStats.txt file contains CPU usage and memory available at the time of testing. The contents of this file is similar to the following example:
Current CPU Usage : 0 % Current Memory Available : 641 MBs
IKElogs.txt
The IKElogs.txt file contains any IKE activity that was found during monitoring.
The following example shows the contents of an IKElogs.txt file.
Remote <IPaddress>:500: Local <IPaddress>:500: [RECEIVED][SA_AUTH] Received IKE AUTH message
Remote <IPaddress>:500: Local <IPaddress>:500: Received Traffic Selector payload request- [Tsid 0x729  ]Number of TSIs 2: StartAddress 10.20.0.0 EndAddress 10.20.255.255 PortStart 0 PortEnd 65535 Protocol 0, StartAddress 192.168.100.0 EndAddress 192.168.100.255 PortStart 0 PortEnd 65535 Protocol 0 Number of TSRs 1:StartAddress 0.0.0.0 EndAddress 255.255.255.255 PortStart 0 PortEnd 65535 Protocol 0
Remote <IPaddress>:500: Local <IPaddress>:500: [SEND] Proposed Traffic Selector payload will be (Final Negotiated) - [Tsid 0x729  ]Number of TSIs 2: StartAddress 10.20.0.0 EndAddress 10.20.255.255 PortStart 0 PortEnd 65535 Protocol 0, StartAddress 192.168.100.0 EndAddress 192.168.100.255 PortStart 0 PortEnd 65535 Protocol 0 Number of TSRs 1:StartAddress 0.0.0.0 EndAddress 255.255.255.255 PortStart 0 PortEnd 65535 Protocol 0
Remote <IPaddress>:500: Local <IPaddress>:500: [RECEIVED]Received IPSec payload: Policy1:Cipher=DESIntegrity=Md5
IkeCleanupQMNegotiation called with error 13868 and flags a
Remote <IPaddress>:500: Local <IPaddress>:500: [SEND][NOTIFY] Sending Notify Message - Policy Mismatch
IKEErrors.txt
The IKEErrors.txt file contains any IKE errors that were found during monitoring.
The following example shows the contents of an IKEErrors.txt file. Your errors might be different depending on the issue.
Error: Authentication failed. Check shared key. Check crypto. Check lifetimes.
	 based on log : Peer failed with Windows error 13801(ERROR_IPSEC_IKE_AUTH_FAIL)
Error: On-prem device sent invalid payload.
	 based on log : IkeFindPayloadInPacket failed with Windows error 13843(ERROR_IPSEC_IKE_INVALID_PAYLOAD)
Scrubbed-wfpdiag.txt
The Scrubbed-wfpdiag.txt log file contains the wfp log. This log contains logging of packet drop and IKE/AuthIP failures.
The following example shows the contents of the Scrubbed-wfpdiag.txt file. In this example, the pre-shared key of a Connection wasn't correct as can be seen from the third line from the bottom. The following example is just a snippet of the entire log, as the log can be lengthy depending on the issue.
...
[0]0368.03A4::02/02/2017-17:36:01.496 [ikeext] 3038|203.0.113.36| Deleted ICookie from the high priority thread pool list
[0]0368.03A4::02/02/2017-17:36:01.496 [ikeext] 3038|203.0.113.36| IKE diagnostic event:
[0]0368.03A4::02/02/2017-17:36:01.496 [ikeext] 3038|203.0.113.36| Event Header:
[0]0368.03A4::02/02/2017-17:36:01.496 [ikeext] 3038|203.0.113.36| Timestamp: 1601-01-01T00:00:00.000Z
[0]0368.03A4::02/02/2017-17:36:01.496 [ikeext] 3038|203.0.113.36| Flags: 0x00000106
[0]0368.03A4::02/02/2017-17:36:01.496 [ikeext] 3038|203.0.113.36| Local address field set
[0]0368.03A4::02/02/2017-17:36:01.496 [ikeext] 3038|203.0.113.36| Remote address field set
[0]0368.03A4::02/02/2017-17:36:01.496 [ikeext] 3038|203.0.113.36| IP version field set
[0]0368.03A4::02/02/2017-17:36:01.496 [ikeext] 3038|203.0.113.36| IP version: IPv4
[0]0368.03A4::02/02/2017-17:36:01.496 [ikeext] 3038|203.0.113.36| IP protocol: 0
[0]0368.03A4::02/02/2017-17:36:01.496 [ikeext] 3038|203.0.113.36| Local address: 203.0.113.92
[0]0368.03A4::02/02/2017-17:36:01.496 [ikeext] 3038|203.0.113.36| Remote address: 203.0.113.36
[0]0368.03A4::02/02/2017-17:36:01.496 [ikeext] 3038|203.0.113.36| Local Port: 0
[0]0368.03A4::02/02/2017-17:36:01.496 [ikeext] 3038|203.0.113.36| Remote Port: 0
[0]0368.03A4::02/02/2017-17:36:01.496 [ikeext] 3038|203.0.113.36| Application ID:
[0]0368.03A4::02/02/2017-17:36:01.496 [ikeext] 3038|203.0.113.36| User SID: <invalid>
[0]0368.03A4::02/02/2017-17:36:01.496 [ikeext] 3038|203.0.113.36| Failure type: IKE/Authip Main Mode Failure
[0]0368.03A4::02/02/2017-17:36:01.496 [ikeext] 3038|203.0.113.36| Type specific info:
[0]0368.03A4::02/02/2017-17:36:01.496 [ikeext] 3038|203.0.113.36| Failure error code:0x000035e9
[0]0368.03A4::02/02/2017-17:36:01.496 [ikeext] 3038|203.0.113.36| IKE authentication credentials are unacceptable
[0]0368.03A4::02/02/2017-17:36:01.496 [ikeext] 3038|203.0.113.36|
[0]0368.03A4::02/02/2017-17:36:01.496 [ikeext] 3038|203.0.113.36| Failure point: Remote
...
wfpdiag.txt.sum
The wfpdiag.txt.sum file is a log showing the buffers and events processed.
The following example is the contents of a wfpdiag.txt.sum file.
Only one VPN troubleshoot operation can be run at a time per subscription. To run another VPN troubleshoot operation, wait for the existing one to complete. Triggering a new operation while a previous one didn't complete causes the subsequent operations to fail.
If you're using Azure CLI to run the command, the VPN Gateway and the Storage account need to be in same resource group. Customers with the resources in different resource groups can use PowerShell or the Azure portal instead.
Network configuration and the use of Virtual Private Networks (VPNs) is integral to the success of collaborative working. In this module, we look at how to monitor and troubleshoot site-to-site and point-to-site VPNs. AZ720 AZ-720 az-720 networking