Troubleshoot Azure VPN Gateway using diagnostic logs
This article helps understand the different logs available for VPN Gateway diagnostics and how to use them to effectively troubleshoot VPN gateway issues.
If your Azure issue is not addressed in this article, visit the Azure forums on Microsoft Q & A and Stack Overflow. You can post your issue in these forums, or post to @AzureSupport on Twitter. You also can submit an Azure support request. To submit a support request, on the Azure support page, select Get support.
The following logs are available* in Azure:
| Name | Description |
|---|---|
| GatewayDiagnosticLog | Contains diagnostic logs for gateway configuration events, primary changes, and maintenance events. |
| TunnelDiagnosticLog | Contains tunnel state change events. Tunnel connect/disconnect events have a summarized reason for the state change if applicable. |
| RouteDiagnosticLog | Logs changes to static routes and BGP (Border Gateway Protocol) events that occur on the gateway. |
| IKEDiagnosticLog | Logs IKE (Internet Key Exchange) control messages and events on the gateway. |
| P2SDiagnosticLog | Logs point-to-site control messages and events on the gateway. |
*for Policy Based gateways, only GatewayDiagnosticLog and RouteDiagnosticLog are available.
Notice that there are several columns available in these tables. In this article, we're only presenting the most relevant ones for easier log consumption.
Set up logging
Follow this procedure to learn how set up diagnostic log events from Azure VPN Gateway using Azure Log Analytics:
Create a new Log Analytics Workspace using the steps found in create a Log Analytics Workspace.
Locate your VPN gateway on the Monitor > Diagnostics settings page.

- Select the VPN gateway and then select Add Diagnostic Setting.

- Input the Diagnostic setting name, choose all the Log categories and select the appropriate Log Analytics Workspace.

Note
It may take a few hours for the data to show up initially.
GatewayDiagnosticLog
Configuration changes are audited in the GatewayDiagnosticLog table. It could take some minutes before changes you execute are reflected in the logs.
Here you have a sample query as reference.
AzureDiagnostics
| where Category == "GatewayDiagnosticLog"
| project TimeGenerated, OperationName, Message, Resource, ResourceGroup
| sort by TimeGenerated asc
This query on GatewayDiagnosticLog shows you multiple columns.
| Name | Description |
|---|---|
| TimeGenerated | the timestamp of each event, in UTC timezone. |
| OperationName | the event that happened. It can be either of SetGatewayConfiguration, SetConnectionConfiguration, HostMaintenanceEvent, GatewayTenantPrimaryChanged, MigrateCustomerSubscription, GatewayResourceMove, ValidateGatewayConfiguration. |
| Message | the detail of what operation is happening, and lists successful/failure results. |
The following example shows the activity logged when a new configuration was applied:
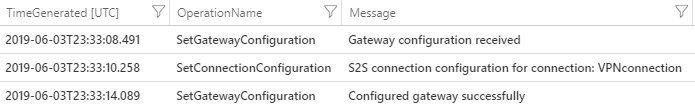
Notice that a SetGatewayConfiguration gets logged every time a configuration is modified both on a VPN Gateway or a Local Network Gateway.
Comparing the results from the GatewayDiagnosticLog table with the results of the TunnelDiagnosticLog table can help determine if a tunnel connectivity failure happened during a configuration change or maintenance activity. If so, it provides a significant indication towards the potential root cause.
TunnelDiagnosticLog
The TunnelDiagnosticLog table is useful to inspect the historical connectivity statuses of the tunnel.
Here you have a sample query as reference.
AzureDiagnostics
| where Category == "TunnelDiagnosticLog"
//| where remoteIP_s == "<REMOTE IP OF TUNNEL>"
| project TimeGenerated, OperationName, remoteIP_s, instance_s, Resource, ResourceGroup
| sort by TimeGenerated asc
This query on TunnelDiagnosticLog shows you multiple columns.
| Name | Description |
|---|---|
| TimeGenerated | the timestamp of each event, in UTC timezone. |
| OperationName | the event that happened. It can be either TunnelConnected or TunnelDisconnected. |
| remoteIP_s | the IP address of the on-premises VPN device. In real world scenarios, it's useful to filter by the IP address of the relevant on-premises device shall there be more than one. |
| Instance_s | the gateway role instance that triggered the event. It can be either GatewayTenantWorker_IN_0 or GatewayTenantWorker_IN_1, which are the names of the two instances of the gateway. |
| Resource | indicates the name of the VPN gateway. |
| ResourceGroup | indicates the resource group where the gateway is. |
Example output:

The TunnelDiagnosticLog is useful to troubleshoot past events about unexpected VPN disconnections. Its lightweight nature offers the possibility to analyze large time ranges over several days with little effort. Only after you identify the timestamp of a disconnection, you can switch to the more detailed analysis of the IKEdiagnosticLog table to dig deeper into the reasoning of the disconnections shall those be IPsec related.
Some troubleshooting tips:
- If you observe a disconnection event on one gateway instance, followed by a connection event on a different gateway instance within a few seconds, it indicates a gateway failover. Such a event typically arises due to maintenance on a gateway instance. To learn more about this behavior, see About Azure VPN gateway redundancy.
- The same behavior is observed if you intentionally run a Gateway Reset on the Azure side - which causes a reboot of the active gateway instance. To learn more about this behavior, see Reset a VPN Gateway.
- If you see a disconnection event on one gateway instance, followed by a connection event on the same gateway instance in a few seconds, you might be looking at a network glitch causing a DPD timeout, or a disconnection erroneously sent by the on-premises device.
RouteDiagnosticLog
The RouteDiagnosticLog table traces the activity for statically modified routes or routes received via BGP.
Here you have a sample query as reference.
AzureDiagnostics
| where Category == "RouteDiagnosticLog"
| project TimeGenerated, OperationName, Message, Resource, ResourceGroup
This query on RouteDiagnosticLog shows you multiple columns.
| Name | Description |
|---|---|
| TimeGenerated | the timestamp of each event, in UTC timezone. |
| OperationName | the event that happened. Can be either of StaticRouteUpdate, BgpRouteUpdate, BgpConnectedEvent, BgpDisconnectedEvent. |
| Message | the detail of what operation is happening. |
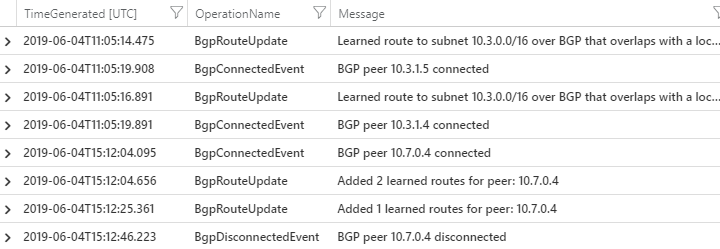
The output shows useful information about BGP peers connected/disconnected and routes exchanged.
Example:
IKEDiagnosticLog
The IKEDiagnosticLog table offers verbose debug logging for IKE/IPsec. This is useful to review when troubleshooting disconnections, or failure to connect VPN scenarios.
Here you have a sample query as reference.
AzureDiagnostics
| where Category == "IKEDiagnosticLog"
| extend Message1=Message
| parse Message with * "Remote " RemoteIP ":" * "500: Local " LocalIP ":" * "500: " Message2
| extend Event = iif(Message has "SESSION_ID",Message2,Message1)
| project TimeGenerated, RemoteIP, LocalIP, Event, Level
| sort by TimeGenerated asc
This query on IKEDiagnosticLog shows you multiple columns.
| Name | Description |
|---|---|
| TimeGenerated | the timestamp of each event, in UTC timezone. |
| RemoteIP | the IP address of the on-premises VPN device. In real world scenarios, it's useful to filter by the IP address of the relevant on-premises device shall there be more than one. |
| LocalIP | the IP address of the VPN Gateway we're troubleshooting. In real world scenarios, it's useful to filter by the IP address of the relevant VPN gateway shall there be more than one in your subscription. |
| Event | contains a diagnostic message useful for troubleshooting. They usually start with a keyword and refer to the actions performed by the Azure Gateway: [SEND] indicates an event caused by an IPSec packet sent by the Azure Gateway. [RECEIVED] indicates an event in consequence of a packet received from on-premises device. [LOCAL] indicates an action taken locally by the Azure Gateway. |
Notice how RemoteIP, LocalIP, and Event columns aren't present in the original column list on AzureDiagnostics database, but are added to the query by parsing the output of the "Message" column to simplify its analysis.
Troubleshooting tips:
In order to identify the start of an IPSec negotiation, you need to find the initial SA_INIT message. Such message could be sent by either side of the tunnel. Whoever sends the first packet is called "initiator" in IPsec terminology, while the other side becomes the "responder". The first SA_INIT message is always the one where rCookie = 0.
If the IPsec tunnel fails to establish, Azure keeps retrying every few seconds. For this reason, troubleshooting "VPN down" issues is convenient on IKEdiagnosticLog because you don't have to wait for a specific time to reproduce the issue. Also, the failure will in theory always be the same every time we try so you could just zoom into one "sample" failing negotiation at any time.
The SA_INIT contains the IPSec parameters that the peer wants to use for this IPsec negotiation. The official document
Default IPsec/IKE parameters lists the IPsec parameters supported by the Azure Gateway with default settings.
P2SDiagnosticLog
The last available table for VPN diagnostics is P2SDiagnosticLog. This table traces the activity for Point to Site (only IKEv2 and OpenVPN protocols).
Here you have a sample query as reference.
AzureDiagnostics
| where Category == "P2SDiagnosticLog"
| project TimeGenerated, OperationName, Message, Resource, ResourceGroup
This query on P2SDiagnosticLog will show you multiple columns.
| Name | Description |
|---|---|
| TimeGenerated | the timestamp of each event, in UTC timezone. |
| OperationName | the event that happened. Will be P2SLogEvent. |
| Message | the detail of what operation is happening. |
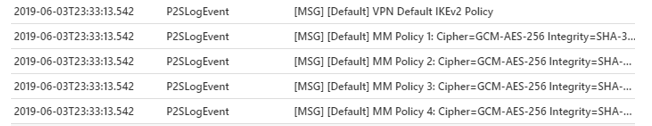
The output shows all of the Point to Site settings that the gateway has applied, and the IPsec policies in place.
Additionally, when a client establishes a connection using OpenVPN and Microsoft Entra ID authentication for point-to-site, the table records packet activity as follows:
[MSG] [default] [OVPN_XXXXXXXXXXXXXXXXXXXXXXXXXXX] Connect request received. IP=0.X.X.X:XXX
[MSG] [default] [OVPN_xxxxxxxxxxxxxxxxxxxxxxxxxxxxxxxxxxx] AAD authentication succeeded. Username=***tosouser@contoso.com
[MSG] [default] [OVPN_xxxxxxxxxxxxxxxxxxxxxxxxxxxxxxxxxxx] Connection successful. Username=***tosouser@contoso.com IP=10.0.0.1
Note
In the point-to-site log, the username is partially obscured. The first octet of the client user IP is substituted with a 0.
Next Steps
To configure alerts on tunnel resource logs, see Set up alerts on VPN Gateway resource logs.
Feedback
Coming soon: Throughout 2024 we will be phasing out GitHub Issues as the feedback mechanism for content and replacing it with a new feedback system. For more information see: https://aka.ms/ContentUserFeedback.
Submit and view feedback for