Deploy, run, and debug your Linux MSBuild project
Linux support is available in Visual Studio 2017 and later. To see the documentation for these versions, set the Version drop-down located above the table of contents to Visual Studio 2017 or Visual Studio 2019.
Once you've created a MSBuild-based Linux C++ project in Visual Studio and you've connected to the project using the Linux Connection Manager, you can run and debug the project. You compile, execute, and debug the code on the remote target.
Visual Studio 2019 version 16.1 and later: You can target different Linux systems for debugging and building. For example, you can cross-compile on x64 and deploy to an ARM device when targeting IoT scenarios. For more information, see Specify different machines for building and debugging later in this article.
There are several ways to interact with and debug your Linux project.
Debug using traditional Visual Studio features, such as breakpoints, watch windows, and hovering over a variable. Using these methods, you may debug as you normally would for other project types.
View output from the target computer in the Linux Console window. You can also use the console to send input to the target computer.
Debug your Linux project
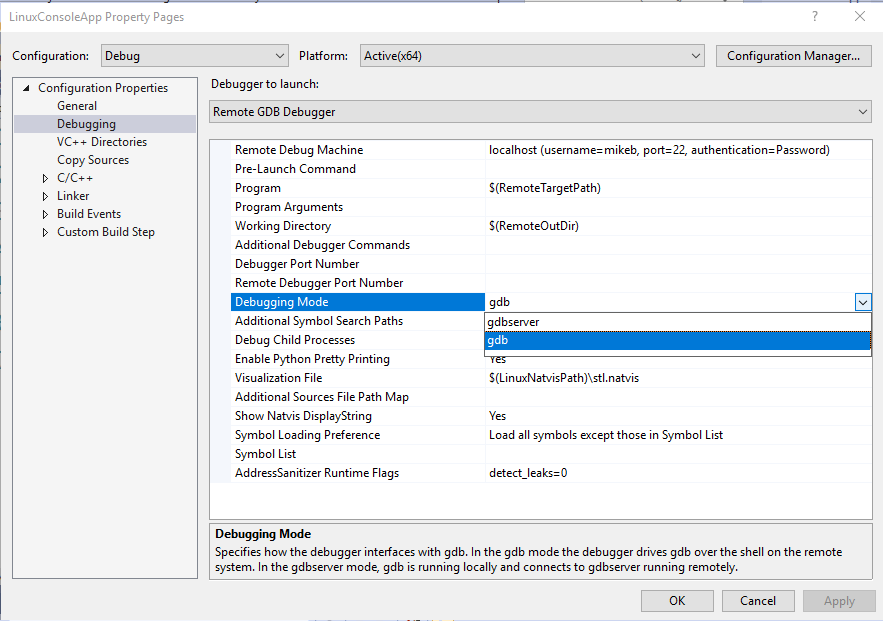
Select debugging mode in the Debugging property page.
GDB is used to debug applications running on Linux. When debugging on a remote system (not WSL) GDB can run in two different modes, which can be selected from the Debugging Mode option in the project's Debugging property page:
GDB is used to debug applications running on Linux. GDB can run in two different modes, which can be selected from the Debugging Mode option in the project's Debugging property page:
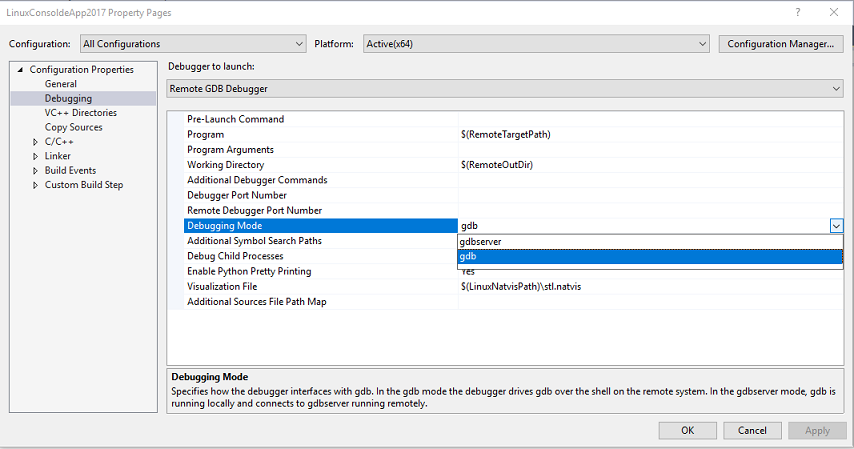
In gdbserver mode, GDB is run locally, which connects to gdbserver on the remote system.
In gdb mode, the Visual Studio debugger drives GDB on the remote system. This is a better option if the local version of GDB isn't compatible with the version installed on the target computer. This is the only mode that the Linux Console window supports.
Note
If you are unable to hit breakpoints in gdbserver debugging mode, try gdb mode. gdb must first be installed on the remote target.
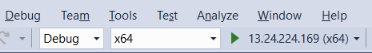
Select the remote target using the standard Debug toolbar in Visual Studio.
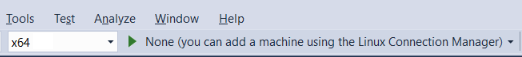
When the remote target is available, you'll see it listed by either name or IP address.
If you haven't connected to the remote target yet, you'll see an instruction to use Linux Connection Manager to connect to the remote target.
Set a breakpoint by clicking in the left gutter of some code that you know will execute.
A red dot appears on the line of code where you set the breakpoint.
Press F5 (or Debug > Start Debugging) to start debugging.
When you start debugging, the application is compiled on the remote target before it starts. Any compilation errors will appear in the Error List window.
If there are no errors, the app will start and the debugger will pause at the breakpoint.

Now, you can interact with the application in its current state, view variables, and step through code by pressing command keys such as F10 or F11.
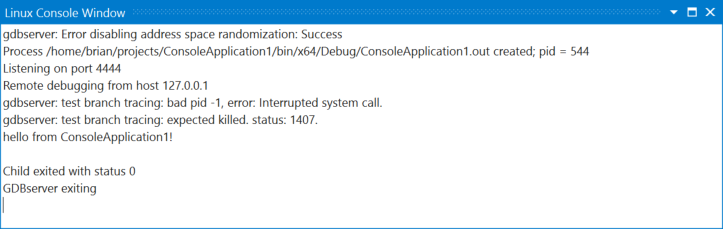
If you want to use the Linux Console to interact with your app, select Debug > Linux Console.
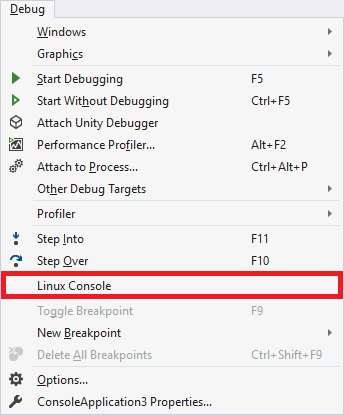
This console will display any console output from the target computer and take input and send it to the target computer.
Configure other debugging options (MSBuild projects)
Command-line arguments can be passed to the executable using the Program Arguments item in the project's Debugging property page.
You can export the
DISPLAYenvironment variable by using the Pre-Launch Command in the project's Debugging property pages. For example:export DISPLAY=:0.0
Specific debugger options can be passed to GDB using the Additional Debugger Commands entry. For example, you might want to ignore SIGILL (illegal instruction) signals. You could use the handle command to achieve this by adding the following to the Additional Debugger Commands entry as shown above:
handle SIGILL nostop noprintYou can specify the path to the GDB used by Visual Studio using the GDB Path item in the project's Debugging property page. This property is available in Visual Studio 2019 version 16.9 and later.
Debug with Attach to Process
The Debugging property page for Visual Studio projects, and the Launch.vs.json settings for CMake projects, have settings that enable you to attach to a running process. If you require more control beyond what is provided in those settings, you can place a file named Microsoft.MIEngine.Options.xml in the root of your solution or workspace. Here is a simple example:
<?xml version="1.0" encoding="utf-8"?>
<SupplementalLaunchOptions>
    <AttachOptions>
      <AttachOptionsForConnection AdditionalSOLibSearchPath="/home/user/solibs">
        <ServerOptions MIDebuggerPath="C:\Program Files (x86)\Microsoft Visual Studio\Preview\Enterprise\Common7\IDE\VC\Linux\bin\gdb\7.9\x86_64-linux-gnu-gdb.exe"
ExePath="C:\temp\ConsoleApplication17\ConsoleApplication17\bin\x64\Debug\ConsoleApplication17.out"/>
        <SetupCommands>
          <Command IgnoreFailures="true">-enable-pretty-printing</Command>
        </SetupCommands>
      </AttachOptionsForConnection>
    </AttachOptions>
</SupplementalLaunchOptions>
The AttachOptionsForConnection has most of the attributes you might need. The example above shows how to specify a location to search for more .so libraries. The child element ServerOptions enables attaching to the remote process with gdbserver instead. To do that, you need to specify a local gdb client (the one shipped in Visual Studio 2017 is shown above) and a local copy of the binary with symbols. The SetupCommands element enables you to pass commands directly to gdb. You can find all the options available in the LaunchOptions.xsd schema on GitHub.
Specify different machines for building and debugging in MSBuild-based Linux projects
You can separate your remote build machine from your remote debug machine for both MSBuild-based Linux projects and CMake projects that target a remote Linux machine. For example, you can now cross-compile on x64 and deploy to an ARM device when targeting IoT scenarios.
By default, the remote debug machine is the same as the remote build machine (Configuration Properties > General > Remote Build Machine). To specify a new remote debug machine, right-click on the project in Solution Explorer and go to Configuration Properties > Debugging > Remote Debug Machine.
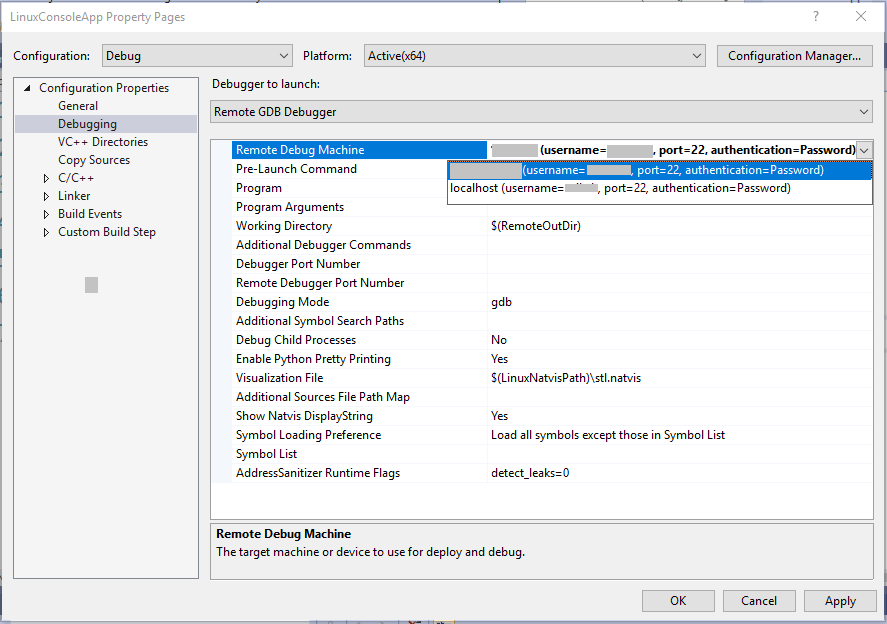
The drop-down menu for Remote Debug Machine is populated with all established remote connections. To add a new remote connection, navigate to Tools > Options > Cross Platform > Connection Manager or search for "Connection Manager" in Quick Launch. You can also specify a new remote deploy directory in the project's Property Pages (Configuration Properties > General > Remote Deploy Directory).
By default, only the files necessary for the process to debug will be deployed to the remote debug machine. You can use Solution Explorer to configure which source files will be deployed to the remote debug machine. When you click on a source file, you'll see a preview of its File Properties directly below the Solution Explorer.
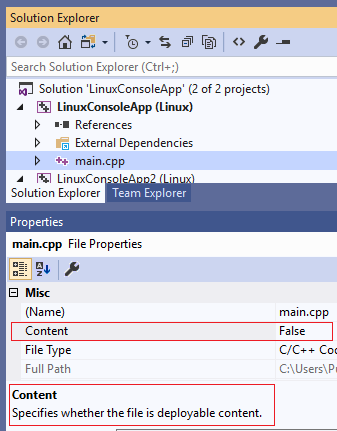
The Content property specifies whether the file will be deployed to the remote debug machine. You can disable deployment entirely by navigating to Property Pages > Configuration Manager and unchecking Deploy for the desired configuration.
In some cases, you may require more control over your project's deployment. For example, some files that you want to deploy might be outside of your solution or you want to customize your remote deploy directory per file or directory. In these cases, append the following code block(s) to your .vcxproj file and replace "example.cpp" with the actual file names:
<ItemGroup>
   <RemoteDeploy Include="__example.cpp">
<!-- This is the source Linux machine, can be empty if DeploymentType is LocalRemote -->
      <SourceMachine>$(RemoteTarget)</SourceMachine>
      <TargetMachine>$(RemoteDebuggingTarget)</TargetMachine>
      <SourcePath>~/example.cpp</SourcePath>
      <TargetPath>~/example.cpp</TargetPath>
<!-- DeploymentType can be LocalRemote, in which case SourceMachine will be empty and SourcePath is a local file on Windows -->
      <DeploymentType>RemoteRemote</DeploymentType>
<!-- Indicates whether the deployment contains executables -->
      <Executable>true</Executable>
   </RemoteDeploy>
</ItemGroup>
CMake projects
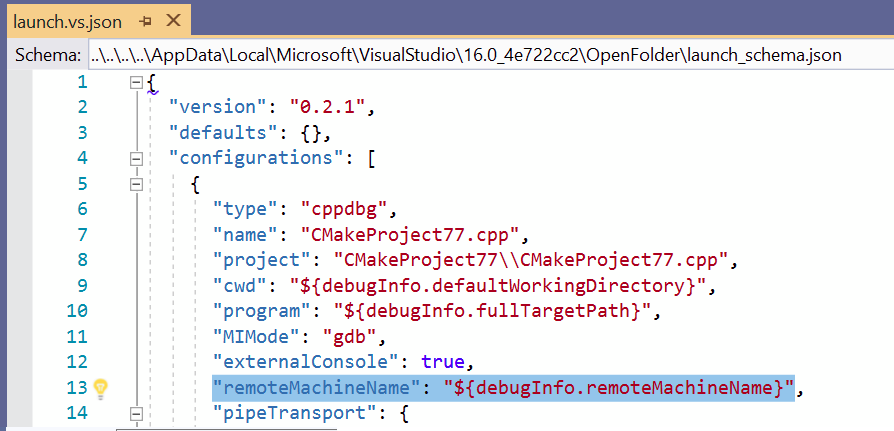
For CMake projects that target a remote Linux machine, you can specify a new remote debug machine in launch.vs.json. By default, the value of "remoteMachineName" is synchronized with the "remoteMachineName" property in CMakeSettings.json, which corresponds to your remote build machine. These properties no longer need to match, and the value of "remoteMachineName" in launch.vs.json will dictate which remote machine is used for deploy and debug.
IntelliSense will suggest all a list of all established remote connections. You can add a new remote connection by navigating to Tools > Options > Cross Platform > Connection Manager or searching for "Connection Manager" in Quick Launch.
If you want complete control over your deployment, you can append the following code block(s) to the launch.vs.json file. Remember to replace the placeholder values with real values:
"disableDeploy": false,
"deployDirectory": "~\foo",
"deploy" : [
   {
      "sourceMachine": "127.0.0.1 (username=example1, port=22, authentication=Password)",
      "targetMachine": "192.0.0.1 (username=example2, port=22, authentication=Password)",
      "sourcePath": "~/example.cpp",
      "targetPath": "~/example.cpp",
      "executable": "false"
   }
]
Next steps
- To debug ARM devices on Linux, see this blog post: Debugging an embedded ARM device in Visual Studio.
See also
Feedback
Coming soon: Throughout 2024 we will be phasing out GitHub Issues as the feedback mechanism for content and replacing it with a new feedback system. For more information see: https://aka.ms/ContentUserFeedback.
Submit and view feedback for