Clean and transform data with Power Query Editor
Now that we've connected to a data source by using Microsoft Power BI Desktop, we must adjust the data to meet our needs. Sometimes, adjusting means transforming the data by, for example, renaming columns or tables, changing text to numbers, removing rows, or setting the first row as a header.
Power Query Editor in Power BI Desktop makes extensive use of shortcut menus (also known as right-click or context menus), in addition to having tasks available on the ribbon. Most of what you can select on the Transform tab on the ribbon is also available by right-clicking an item (like a column) and then selecting a command on the shortcut menu that appears.
Shape data
When you shape data in Power Query Editor, you're providing step-by-step instructions that Power Query Editor will carry out to adjust the data as it loads and presents it. The original data source isn't affected. Only this particular view of the data is adjusted, or shaped.
The steps you specify (for example, rename a table, transform a data type, or delete columns) are recorded by Power Query Editor. Those steps are then carried out each time the query connects to the data source, so that the data is always shaped the way you specify. This process occurs whenever you use the query in Power BI Desktop, or whenever anyone else uses your shared query (for example, in the Power BI service). The steps are captured sequentially under Applied Steps in the Power Query Settings pane.
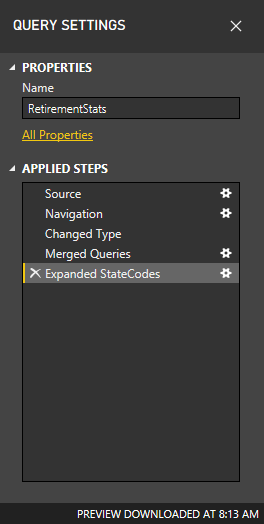
The following image shows the Query Settings pane for a query that has been shaped. We'll go through each of the steps in the next few paragraphs.
Let's return to the retirement data that we found by connecting to a Web data source, and let's shape that data to fit our needs.
Note
See the previous unit page if you have not downloaded the sample data set.
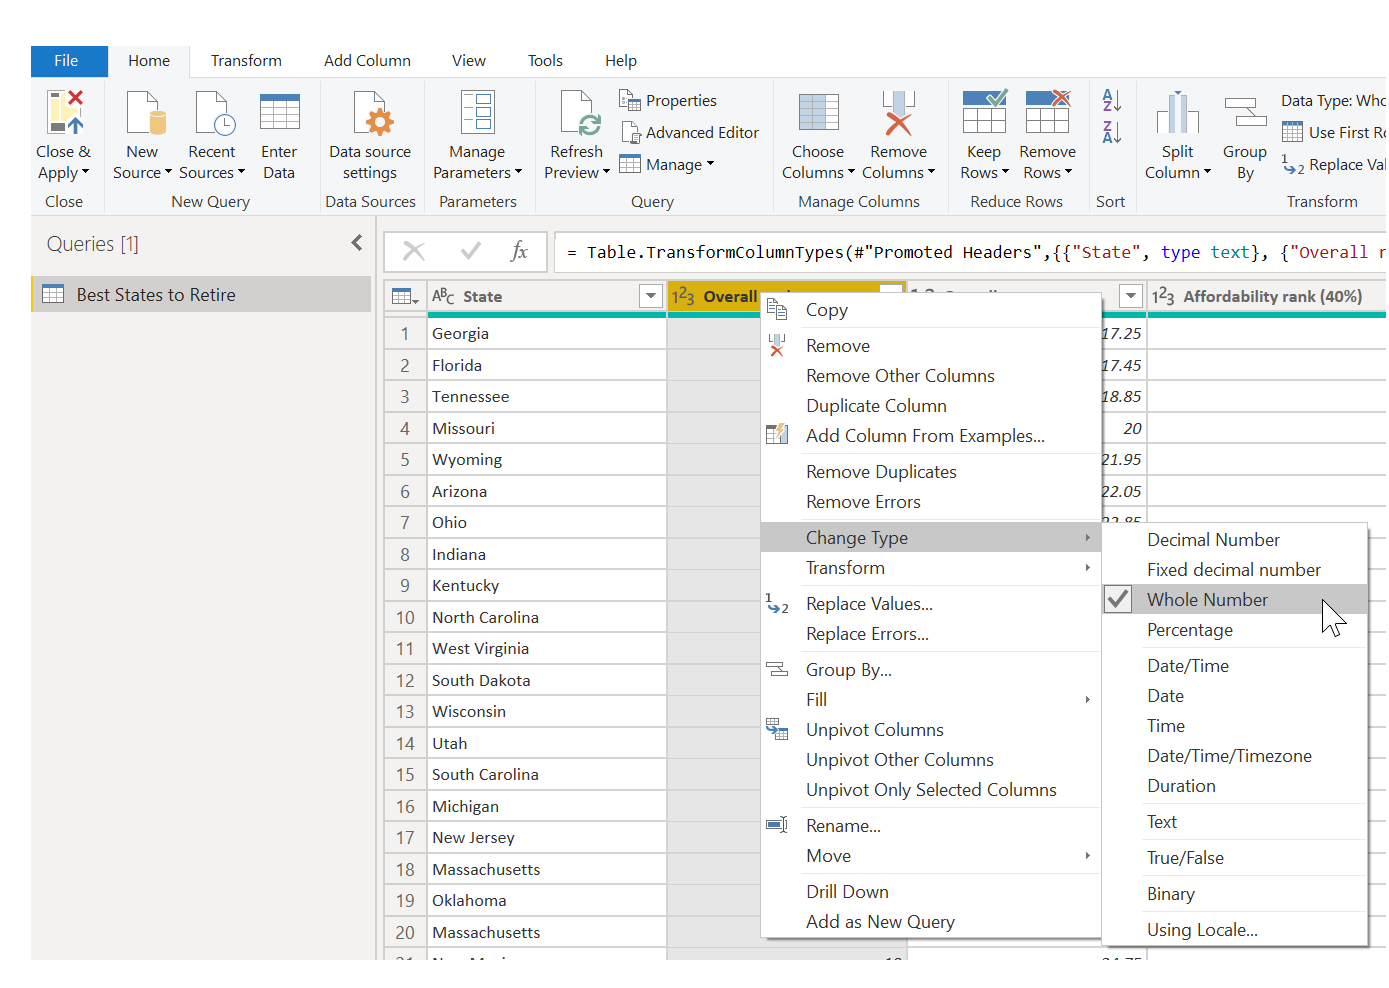
We need the data to be numbers. They are fine in this case but if you ever need to change the data type, just right-click the column header, and then select Change Type > Whole Number. If you must change more than one column, select one of them, and then hold down the Shift key while you select additional adjacent columns. Then right-click a column header to change all the selected columns. You can also use the Ctrl key to select non-adjacent columns.
Note
Often, Power Query will detect that a column of text should be numbers, and will automatically change the data type when it brings the table into Power Query Editor. In this case, a step under Applied steps identifies what Power Query did for you.
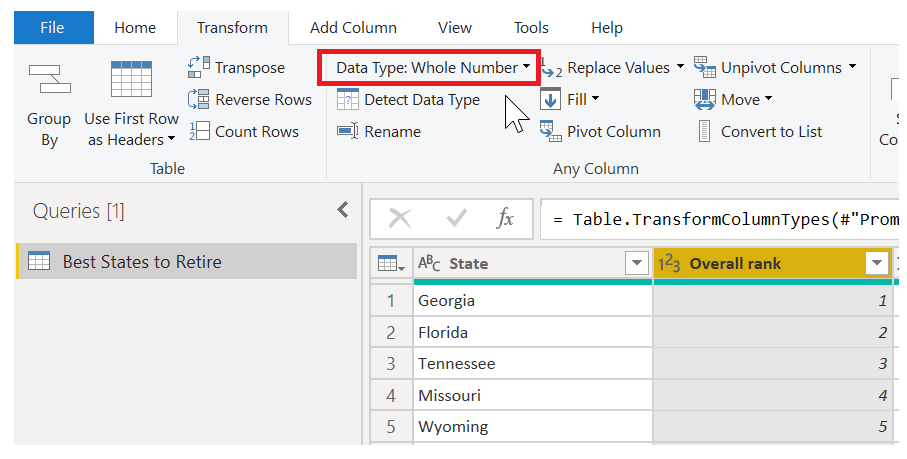
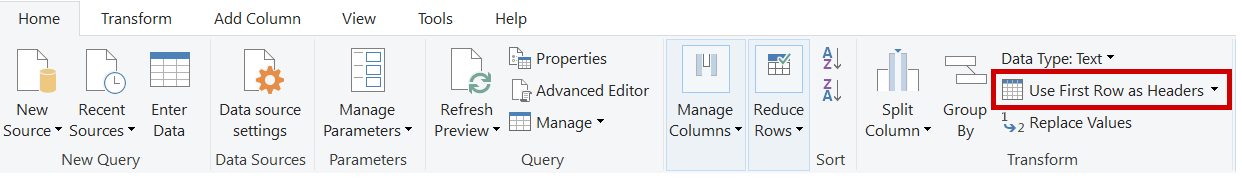
You can also change, or transform, those columns from text to header by using the Transform tab on the ribbon. The following image shows the Transform tab. The red box highlights the Data Type button, which lets you transform the current data type to another.
Notice that the Applied Steps list in the Query Settings pane reflects all the changes that were made. To remove any step from the shaping process, just select it, and then select the X to the left of it.
Connect to data
That data about different states is interesting, and will be useful for building additional analysis efforts and queries. But there's one problem: most data out there uses a two-letter abbreviation for state codes, not the full name of the state. Therefore, we need some way to associate state names with their abbreviations.
We're in luck: there's another public data source that does just that, but it needs a fair amount of shaping before we can connect it to our retirement table. Here's the web resource for state abbreviations:
http://en.wikipedia.org/wiki/List_of_U.S._state_abbreviations
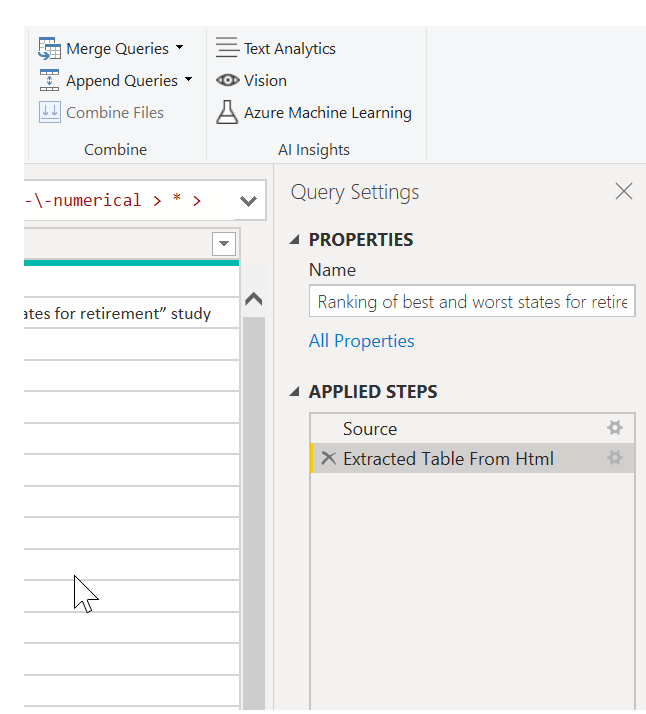
In Power Query Editor, on the Home tab on the ribbon, select New Source > Web. Then enter the address, and select OK. The Navigator window shows what it found on that webpage.
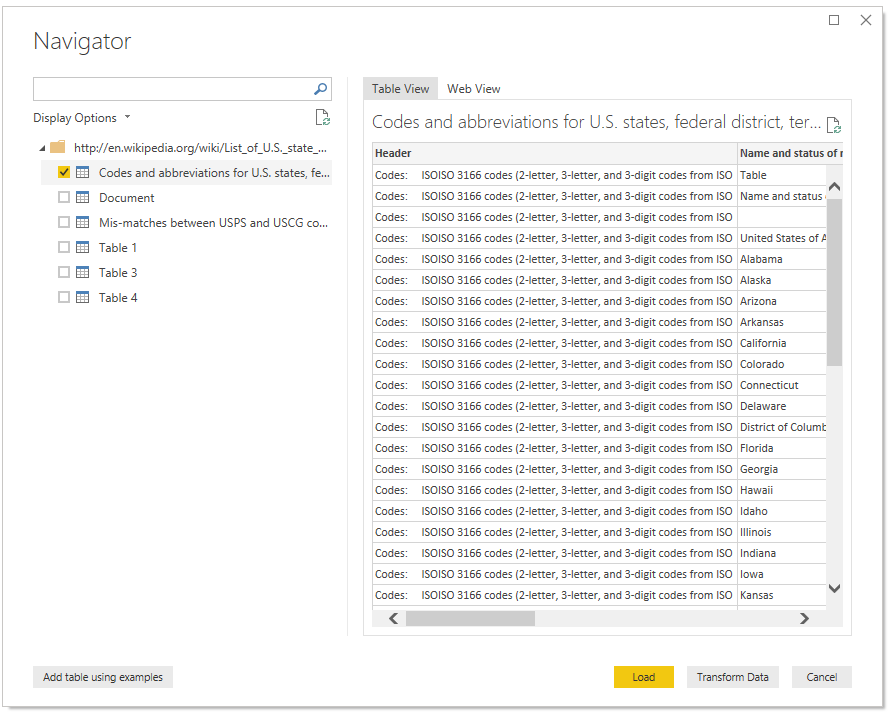
Select the Codes and abbreviations... table, because it includes the data we want, although it's going to take quite a bit of shaping to pare down that data.
Select Load to bring the data into Power Query Editor so that we can shape it. Then follow these steps:
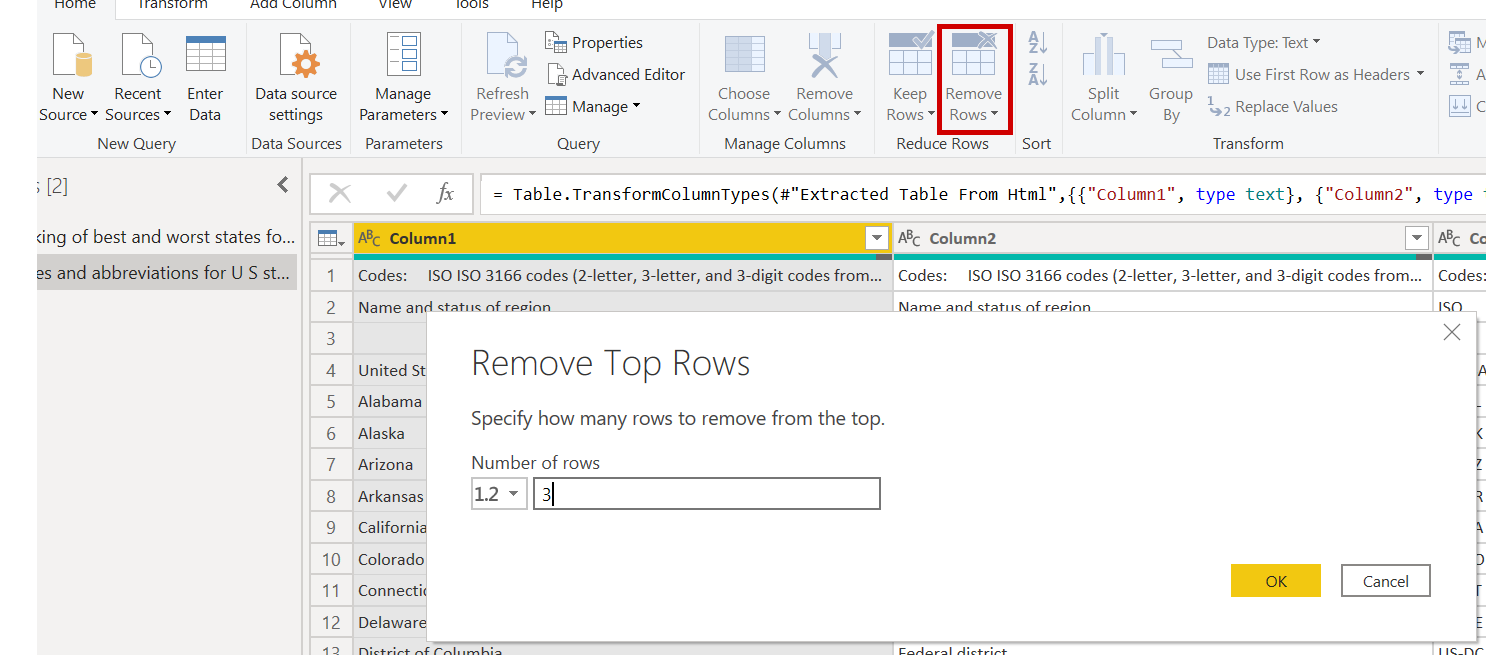
Remove the top three rows – Those rows are a result of the way the webpage's table was created, and we don't need them. To remove them, on the Home tab on the ribbon, select Remove rows > Remove Top Rows. In the dialog box that appears, enter 3 as the number of rows to remove.
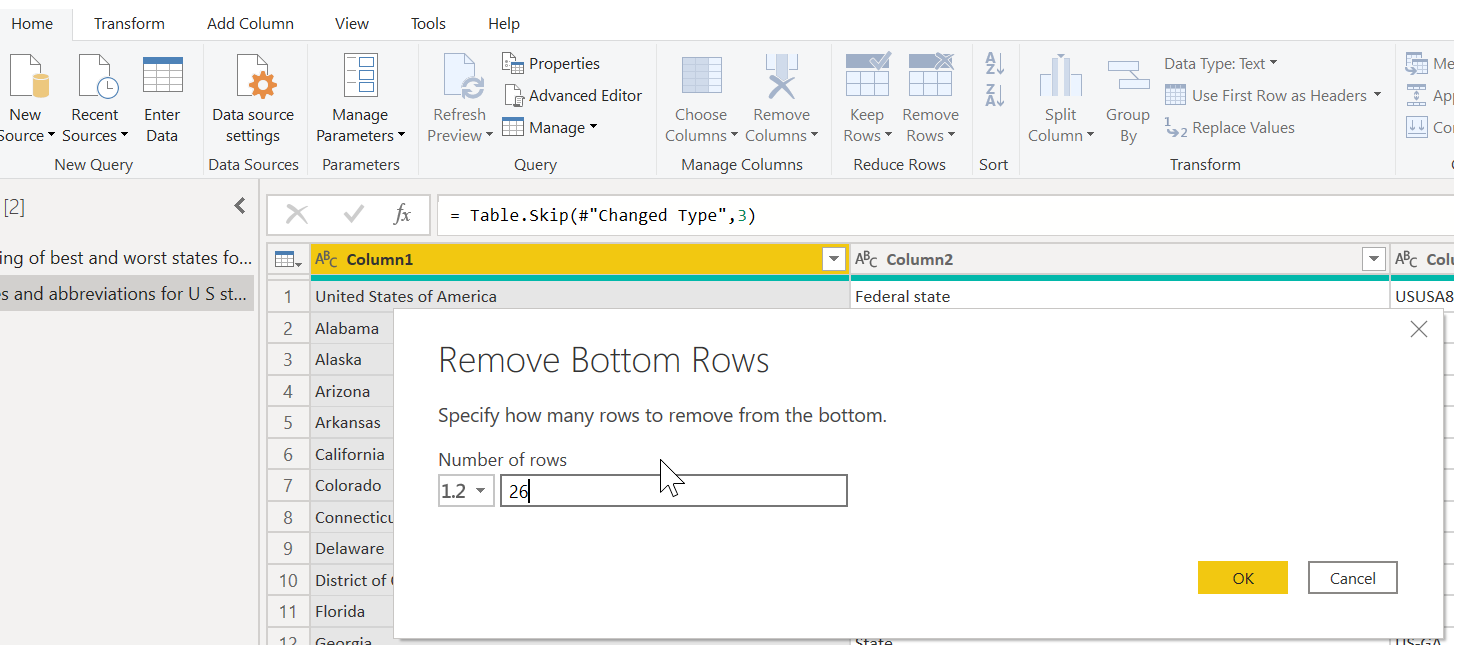
Remove the bottom 26 rows – Those rows are all for territories, which we don't need to include. The process is the same, but this time, select Remove rows > Remove Bottom Rows, and enter 26 as the number of rows to remove.
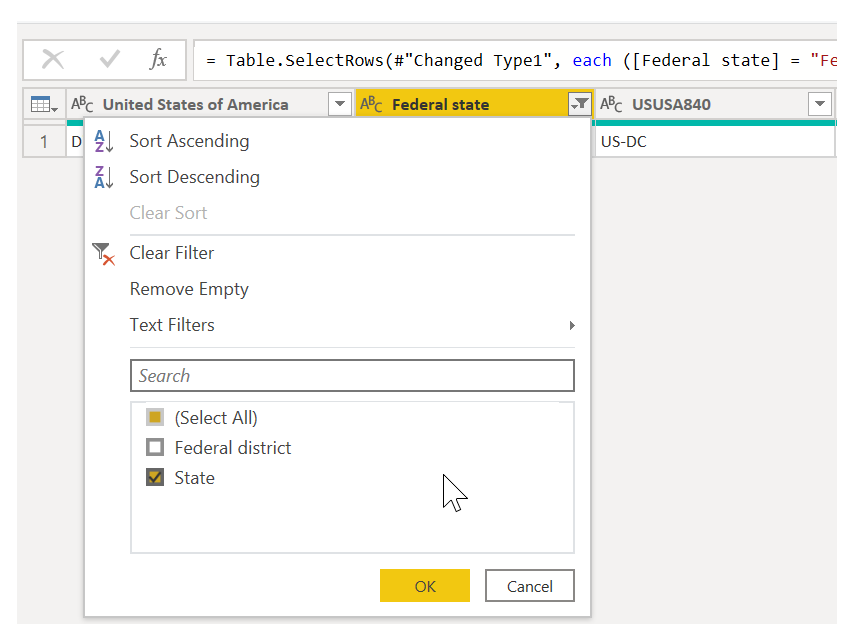
Filter out Washington, DC – The retirement stats table doesn't include Washington, DC, so we'll exclude it from our list. Select the drop-down arrow beside the Federal state column, and then clear the Federal district check box.
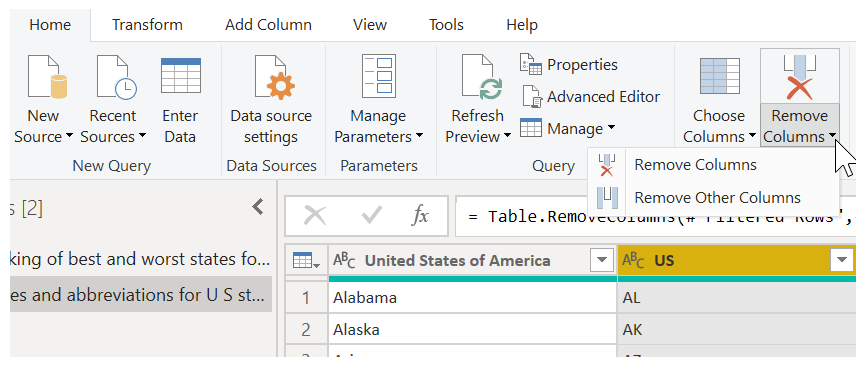
Remove a few unneeded columns – We just need the mapping of each state to its official two-letter abbreviation, and that information is given in the first and fourth columns. Therefore, we just need to keep those two columns and can remove all the others. Select the first column to remove, and then hold down the Ctrl key while you select the other columns to remove (this lets you select multiple, non-adjacent columns). Then, on the Home tab on the ribbon, select Remove Columns > Remove Columns.
Use the first row as headers – Because we removed the top three rows, the current top row is the header we want. Select the Use first row as headers button.
Note
This is a good time to point out that the sequence of applied steps in Power Query Editor is important and can affect how the data is shaped. It's also important to consider how one step might affect another subsequent step. If you remove a step from the Applied Steps list, subsequent steps might not behave as originally intended, because of the impact of the query's sequence of steps.
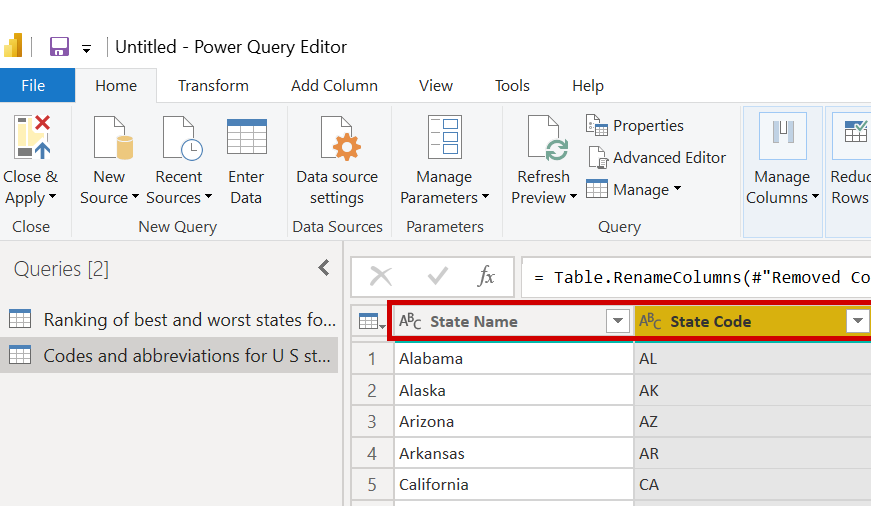
Rename the columns and the table itself – As usual, there are a couple ways to rename a column. You can use whichever way you prefer. Let's rename them State Name and State Code. To rename the table, just enter the name in the Name field in the Query Settings pane. Let's call this table StateCodes.
Combine data
Now that the StateCodes table is shaped, we can combine our two tables into one. Because the tables that we now have are a result of the queries we applied to the data, they're often referred to as queries.
There are two primary ways of combining queries: merging and appending.
When you have one or more columns that you want to add to another query, you merge the queries. When you have additional rows of data to add to an existing query, you append the query.
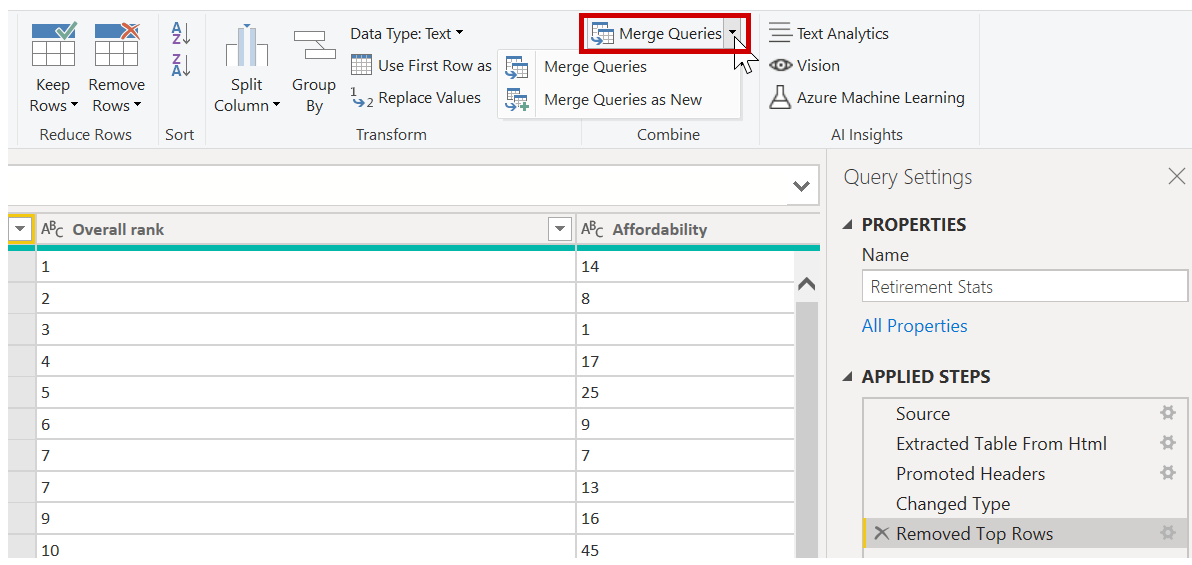
In this case, we want to merge the queries. To get started, select the query to merge the other query into. Then, on the Home tab on the ribbon, select Merge Queries. We want to select our retirement query first. While we're at it, let's rename that query RetirementStats.
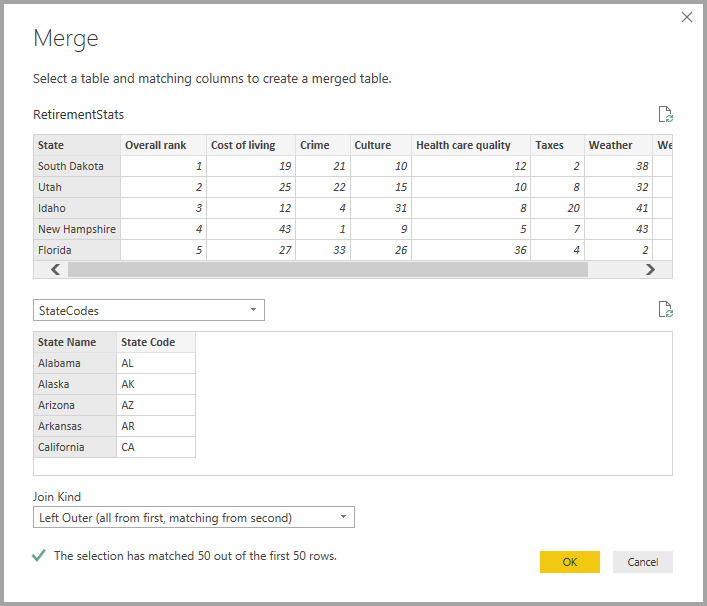
The Merge dialog box appears, prompting us to select the table to merge into the selected table, and the matching columns to use for the merge.
Select State from the RetirementStats table (query), and then select the StateCodes query. (In this case, the choice is easy, because there's only one other query. But when you connect to many data sources, there will be many queries to choose from.) After you select the correct matching columns—State from RetirementStats and State Name from StateCodes—the Merge dialog box will look like this, and the OK button will become available.
A NewColumn is created at the end of the query and is the contents of the table (query) that was merged with the existing query. All columns from the merged query are condensed into the NewColumn, but you can expand the table and include whichever columns you want. To expand the merged table and select the columns to include, select the expand icon ( ). The Expand dialog box appears.
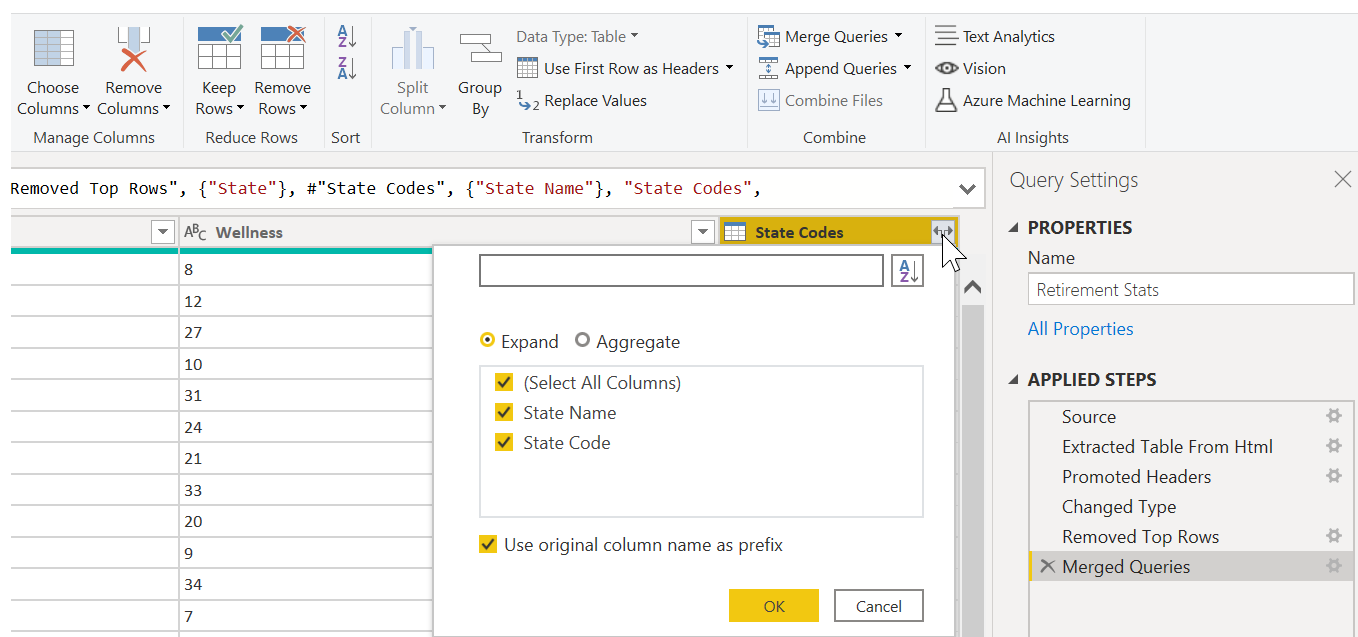
In this case, we just want the State Code column. Therefore, select only that column, and then select OK. You can also clear the Use original column name as prefix check box. If you leave it selected, the merged column will be named NewColumn.State Code (the original column name, or NewColumn, then a dot, and then the name of the column that's being brought into the query).
Note
If you want, you can play around with how the NewColumn table is brought in. If you don't like the results, just delete the Expand step from the Applied Steps list in the Query Settings pane. Your query will return to the state it was in before you applied that step. It's like a free do-over that you can do as many times as you want, until the expand process looks the way you want.
We now have a single query (table) that combines two data sources, each of which has been shaped to meet our needs. This query can serve as a basis for lots of additional, interesting data connections, like housing cost statistics, demographics, or job opportunities in any state.
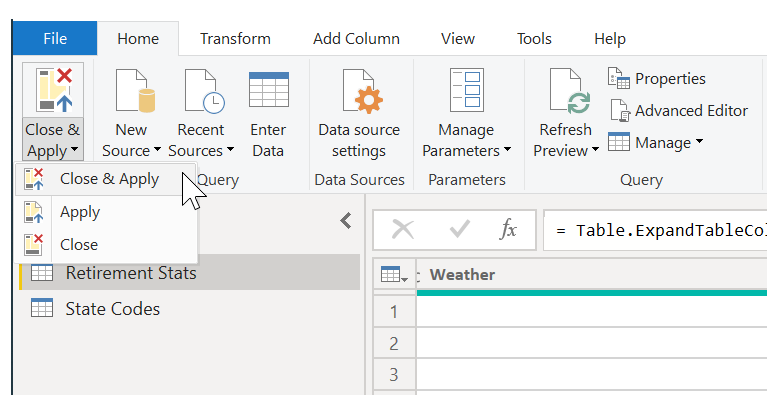
To apply the changes in Power Query Editor and load them into Power BI Desktop, select Close & Apply on the Home tab on the ribbon.
The data in your model is now ready to work with. Next, we'll create some visuals for your report.
For now, we have enough data to create a few interesting reports, all in Power BI Desktop. Because this is a milestone, let's save this Power BI Desktop file. Select File > Save on the Home tab on the ribbon to save the report—we'll call it Getting Started with Power BI Desktop.
Great! Now on to the next unit, where we'll create some interesting visuals.