Troubleshoot CMPivot
CMPivot is a tool that provides access to a real-time state of the devices in your environment. CMPivot runs a query on all currently connected devices in the target collection and returns the results.
Occasionally, you might need to troubleshoot CMPivot. For example, if a state message from a client to CMPivot gets corrupted, the site server can't process the message. This article helps you understand the flow of information for CMPivot.
Troubleshoot CMPivot in version 1902 and later
In Configuration Manager versions 1902 and later, you can run CMPivot from the central administration site (CAS) in a hierarchy. The primary site still handles the communication to the client.
When you run CMPivot from CAS, it uses the high-speed message subscription channel to communicate with the primary site. CMPivot doesn't use standard SQL Server replication between sites. If your SQL Server instance or your SMS provider is remote, or if you use a SQL Server Always On availability group, you'll have a "double hop scenario" for CMPivot. For information on how to define constrained delegation for a "double hop scenario", see CMPivot starting in version 1902.
Important
When troubleshooting CMPivot, enable verbose logging on your management points (MPs) and on the site server's SMS_MESSAGE_PROCESSING_ENGINE to get more information. Also, if the client's output is larger than 80 KB, enable verbose logging on the MP and the site server's SMS_STATE_SYSTEM component. For information about how to enable verbose logging, see Site server logging options.
Get information from the site server
By default, the site server log files are located in C:\Program Files\Microsoft Configuration Manager\logs. This location might be different if you specified a non-default installation directory or offloaded items like the SMS Provider to another server. If you run CMPivot from the CAS, the logs are on the primary site server.
Look in smsprov.log for these lines:
Configuration Manager version 1906:
Auditing: User <username> initiated client operation 145 to collection <CollectionId>.Configuration Manager version 1902:
Type parameter is 135.
Auditing: User <username> ran script 7DC6B6F1-E7F6-43C1-96E0-E1D16BC25C14 with hash dc6c2ad05f1bfda88d880c54121c8b5cea6a394282425a88dd4d8714547dc4a2 on collection <CollectionId>.
7DC6B6F1-E7F6-43C1-96E0-E1D16BC25C14 is the Script-Guid for CMPivot. You can also see this GUID in CMPivot audit status messages.
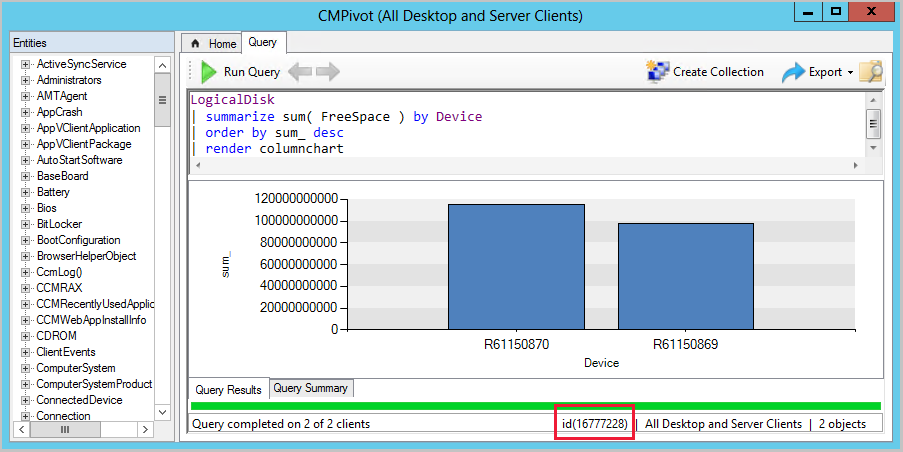
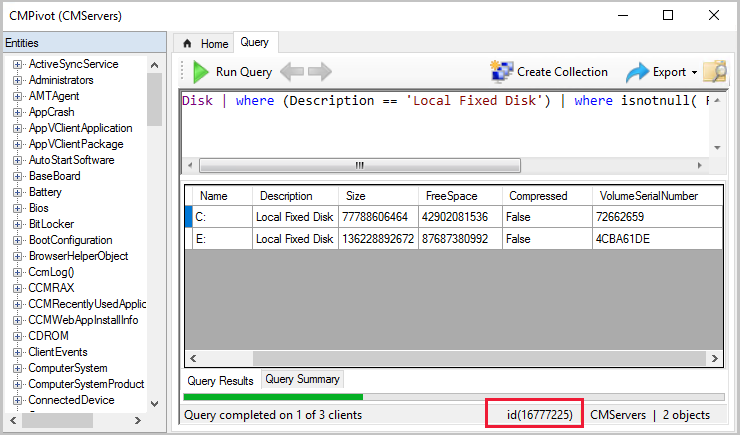
Next, find the ID in the CMPivot window. This ID is the ClientOperationID.
Find the TaskID from the ClientAction table. The TaskID corresponds to the UniqueID in the ClientAction table.
select * from ClientAction where ClientOperationId=<id>
In BgbServer.log, look for the TaskID you gathered from SQL Server and note the PushID. The TaskID is labeled TaskGUID. For example:
Starting to send push task (PushID: 9 TaskID: 12 TaskGUID: 9A4E59D2-2F5B-4067-A9FA-B99602A3A4A0 TaskType: 15 TaskParam: PFNjcmlwdENvbnRlbnQgU2NyaXB0R3VpZD0nN0RDNkI2RjEtRTdGNi00M0MxL (truncated log entry)
Finished sending push task (PushID: 9 TaskID: 12) to 2 clients
Client logs
After you have the information from the site server, check the client logs. By default, the client logs are located in C:\Windows\CCM\Logs.
In CcmNotificationAgent.log, look for log entries that look like the following lines:
Receive task from server with pushid=9, taskid=12, taskguid=9A4E59D2-2F5B-4067-A9FA-B99602A3A4A0, tasktype=15 and taskParam=PFNjcmlwdEhhc2ggU2NyaXB0SGF (truncated log entry)
Send Task response message <BgbResponseMessage TimeStamp="2019-09-13T17:29:09Z"><PushID>5</PushID><TaskID>4</TaskID><ReturnCode>1</ReturnCode></BgbResponseMessage> successfuly.
Check Scripts.log for the TaskID. In the following example, you see Task ID {9A4E59D2-2F5B-4067-A9FA-B99602A3A4A0}:
Sending script state message (fast): {9A4E59D2-2F5B-4067-A9FA-B99602A3A4A0}
Result are sent for ScriptGuid: 7DC6B6F1-E7F6-43C1-96E0-E1D16BC25C14 and TaskID: {9A4E59D2-2F5B-4067-A9FA-B99602A3A4A0}
Note
If you don't see "(fast)" in the Scripts.log, then the data is likely over 80 KB. In this case, the information is sent to the site server as a state message. Use client's StateMessage.log and the site server's Statesys.log.
Review messages on the site server
When verbose logging is enabled on the management point, you can see how incoming client messages are handled. In MP_RelayMsgMgr.log, look for the TaskID.
In the MP_RelayMsgMgr.log example, you can see the client's ID (GUID:83F67728-2E6D-4E4F-8075-ED035C31B783) and the Task ID {9A4E59D2-2F5B-4067-A9FA-B99602A3A4A0}. A message ID gets assigned to the client's response before it's sent to the message processing engine:
MessageKey: GUID:83F67728-2E6D-4E4F-8075-ED035C31B783{9A4E59D2-2F5B-4067-A9FA-B99602A3A4A0}
Create message succeeded for message id 22f00adf-181e-4bad-b35e-d18912f39f89
Add message payload succeeded for message id 22f00adf-181e-4bad-b35e-d18912f39f89
Put message succeeded for message id 22f00adf-181e-4bad-b35e-d18912f39f89
CRelayMsgMgrHandler::HandleMessage(): ExecuteTask() succeeded
When verbose logging is enabled on SMS_MESSAGE_PROCESSING_ENGINE.log, the client results are processed. Use the message ID you found from the MP_RelayMsgMgr.log. The processing log entries are similar to the following example:
Processing 2 messages with type Instant and IDs 22f00adf-181e-4bad-b35e-d18912f39f89[19], 434d80ae-09d4-4d84-aebf-28a4a29a9852[20]...
Processed 2 messages with type Instant. Failed to process 0 messages. All message IDs 22f00adf-181e-4bad-b35e-d18912f39f89[19], 434d80ae-09d4-4d84-aebf-28a4a29a9852[20]
Tip
If you get an exception during processing, you can review it by running the following SQL query and looking at the Exception column. After the message is processed, it will no longer be in the MPE_RequestMessages_Instant table.
select * from MPE_RequestMessages_Instant where MessageID=<ID from SMS_MESSAGE_PROCESSING_ENGINE.log>
In BgbServer.log, look for the PushID to see the number of clients that reported or failed.
Generated BGB task status report c:\ConfigMgr\inboxes\bgb.box\Bgb5c1db.BTS at 09/16/2019 16:46:39. (PushID: 9 ReportedClients: 2 FailedClients: 0)
Check the monitoring view for CMPivot from SQL Server by using the TaskID.
select * from vSMS_CMPivotStatus where TaskID='{9A4E59D2-2F5B-4067-A9FA-B99602A3A4A0}'

Troubleshoot CMPivot in 1810 and earlier
In Configuration Manager versions 1810 and earlier, your site server handles the communication to the client.
Get information from the site server
By default, the site server log files are located in C:\Program Files\Microsoft Configuration Manager\logs. This location might be different if you specified a non-default installation directory or offloaded items like the SMS Provider to another server.
Look in smsprov.log for this line:
Auditing: User <username> initiated client operation 135 to collection <CollectionId>.
Find the ID in the CMPivot window. This ID is the ClientOperationID.
Find the TaskID from the ClientAction table. The TaskID corresponds to the UniqueID in the ClientAction table.
select * from ClientAction where ClientOperationId=<id>
In BgbServer.log, look for the TaskID you gathered from SQL. It's labeled TaskGUID. For example:
Starting to send push task (PushID: 260 TaskID: 258 TaskGUID: F8C7C37F-B42B-4C0A-B050-2BB44DF1098A TaskType: 15
TaskParam: PFNjcmlwdEhhc2ggU2NyaXB0SGF...truncated...to 5 clients with throttling (strategy: 1 param: 42)
Finished sending push task (PushID: 260 TaskID: 258) to 5 clients
Client logs
After you have the information from the site server, check the client logs. By default, the client logs are located in C:\Windows\CCM\Logs.
In CcmNotificationAgent.log, look for logs that are similar to the following entry:
Error! Bookmark not defined.+PFNjcmlwdEhhc2ggU2NyaXB0SGFzaEFsZz0nU0hBMjU2Jz42YzZmNDY0OGYzZjU3M2MyNTQyNWZiNT
g2ZDVjYTIwNzRjNmViZmQ1NTg5MDZlMWI5NDRmYTEzNmFiMDE0ZGNjPC9TY3JpcHRIYXNoPjxTY3Jp (truncated log entry)
Look in Scripts.log for the TaskID. In the following example, we see Task ID {F8C7C37F-B42B-4C0A-B050-2BB44DF1098A}:
Sending script state message: 7DC6B6F1-E7F6-43C1-96E0-E1D16BC25C14
State message: Task Id {F8C7C37F-B42B-4C0A-B050-2BB44DF1098A}
Look in StateMessage.log. In the following example, you see that TaskID is near the bottom of the message next to <Param>:
StateMessage body: <?xml version="1.0" encoding="UTF-16"?>
<Report><ReportHeader><Identification><Machine><ClientInstalled>1</ClientInstalled><ClientType>1
</ClientType><ClientID>GUID:DBAC52C9-57E6-47D7-A8D6-E0A5A64B57E6</ClientID><ClientVersion>5.00.8670.1000</ClientVersion>
<NetBIOSName>R613924</NetBIOSName><CodePage>437</CodePage>
<SystemDefaultLCID>1033</SystemDefaultLCID><Priority>0</Priority></Machine></Identification>
<ReportDetails><ReportContent>State Message Data</ReportContent><ReportType>Full</ReportType>
<Date>20180703184447.673000+000</Date><Version>1.0</Version><Format>1.0</Format>
</ReportDetails></ReportHeader><ReportBody><StateMessage MessageTime="20180703184447.517000+000"><Topic ID="7DC6B6F1-E7F6-43C1-96E0-E1D16BC25C14" Type="9003" IDType="0" User="" UserSID=""/><State ID="1" Criticality="0"/>
<StateDetails Type="1"><![CDATA["PAA/AHgAbQBsACAAdgBlAHIAcwBpAG8AbgA9ACIAMQAuADAAIgAgAGUAbgBjAG8AZABpAG4AZwA9ACIAdQB0AGYALQAxADYAIgA/AD4APAByAGUAcwB1AGwAdAAgAFIAZQBzAHUAbAB0AEMAbwBkAGUAPQAiADAAIgA+ADwAZQAgAE4AYQBtAGUAPQAiAEkAbgB0AGUAbAAoAFIAKQAgAFgAZQBvAG4AKABSACkAIABDAFAAVQAgAEUANQAtADIANgA3ADMAIAB2ADQAIABAACAAMgAuADMAMABHAEgAegAiACAATQBhAG4AdQBmAGEAYwB0AHUAcgBlAHIAPQAiAEEAbQBlAHIAaQBjAGEAbgAgAE0AZQBnAGEAdAByAGUAbgBkAHMAIABJAG4AYwAuACIAIABWAGUAcgBzAGkAbwBuAD0AIgBWAFIAVABVAEEATAAgAC0AIAA2ADAAMAAxADcAMAAyACIAIABSAGUAbABlAGEAcwBlAEQAYQB0AGUAPQAiADIAMAAxADcALQAwADYALQAwADIAIAAwADAAOgAwADAAOgAwADAAIgAgAFMAZQByAGkAYQBsAE4AdQBtAGIAZQByAD0AIgAwADAAMAAwAC0AMAAwADEAOAAtADMANgA4ADIALQA0ADcAMAA4AC0ANwA2ADQAMAAtADcANgAwADAALQAzADMAIgAgAFMATQBCAEkATwBTAEIASQBPAFMAVgBlAHIAcwBpAG8AbgA9ACIAMAA5ADAAMAAwADcAIAAiACAALwA+ADwALwByAGUAcwB1AGwAdAA+AA=="~~]]></StateDetails><UserParameters Flags="0" Count="2">
<Param>{F8C7C37F-B42B-4C0A-B050-2BB44DF1098A}</Param><Param>0</Param></UserParameters></StateMessage></ReportBody></Report>

Successfully forwarded State Messages to the MP StateMessage 7/3/2018 11:44:47 AM 5036 (0x13AC)
Review messages on the site server
Open statesys.log to see if the message is received and processed. In the following example, you see TaskID near the bottom of the message next to <Param>. Enable verbose logging on the SMS_STATE_SYSTEM component to see these log entries.
CMessageProcessor - the cmdline to DB exec dbo.spProcessStateReport N'?<?xml version="1.0" encoding="UTF-
16"?>~~<Report><ReportHeader><Identification><Machine><ClientInstalled>1</ClientInstalled><ClientType>1
</ClientType><ClientID>GUID:DBAC52C9-57E6-47D7-A8D6-E0A5A64B57E6</ClientID><ClientVersion>5.00.8670.1000</ClientVersion>
<NetBIOSName>R613924</NetBIOSName><CodePage>437</CodePage>
<SystemDefaultLCID>1033</SystemDefaultLCID><Priority>0</Priority></Machine></Identification>
<ReportDetails><ReportContent>State Message Data</ReportContent><ReportType>Full</ReportType>
<Date>20180703184447.673000+000</Date><Version>1.0</Version><Format>1.0</Format>
</ReportDetails></ReportHeader><ReportBody><StateMessage MessageTime="20180703184447.517000+000"><Topic ID="7DC6B6F1-E7F6-43C1-96E0-E1D16BC25C14" Type="9003" IDType="0" User="" UserSID=""/><State ID="1" Criticality="0"/>
<StateDetails Type="1"><![CDATA["PAA/AHgAbQBsACAAdgBlAHIAcwBpAG8AbgA9ACIAMQAuADAAIgAgAGUAbgBjAG8AZABpAG4AZwA9ACIAdQB0AGYALQAxADYAIgA/AD4APAByAGUAcwB1AGwAdAAgAFIAZQBzAHUAbAB0AEMAbwBkAGUAPQAiADAAIgA+ADwAZQAgAE4AYQBtAGUAPQAiAEkAbgB0AGUAbAAoAFIAKQAgAFgAZQBvAG4AKABSACkAIABDAFAAVQAgAEUANQAtADIANgA3ADMAIAB2ADQAIABAACAAMgAuADMAMABHAEgAegAiACAATQBhAG4AdQBmAGEAYwB0AHUAcgBlAHIAPQAiAEEAbQBlAHIAaQBjAGEAbgAgAE0AZQBnAGEAdAByAGUAbgBkAHMAIABJAG4AYwAuACIAIABWAGUAcgBzAGkAbwBuAD0AIgBWAFIAVABVAEEATAAgAC0AIAA2ADAAMAAxADcAMAAyACIAIABSAGUAbABlAGEAcwBlAEQAYQB0AGUAPQAiADIAMAAxADcALQAwADYALQAwADIAIAAwADAAOgAwADAAOgAwADAAIgAgAFMAZQByAGkAYQBsAE4AdQBtAGIAZQByAD0AIgAwADAAMAAwAC0AMAAwADEAOAAtADMANgA4ADIALQA0ADcAMAA4AC0ANwA2ADQAMAAtADcANgAwADAALQAzADMAIgAgAFMATQBCAEkATwBTAEIASQBPAFMAVgBlAHIAcwBpAG8AbgA9ACIAMAA5ADAAMAAwADcAIAAiACAALwA+ADwALwByAGUAcwB1AGwAdAA+AA=="~~]]></StateDetails><UserParameters Flags="0" Count="2">
<Param>{F8C7C37F-B42B-4C0A-B050-2BB44DF1098A}</Param><Param>0</Param></UserParameters></StateMessage></ReportBody></Report>~~'
If the message hasn't been processed, check the state message inbox. The default inbox location is C:\Program Files\Microsoft Configuration Manager\inboxes\auth\statesys.box\. Look for the files in these locations:
- Incoming
- Corrupted
- Process
Check the monitoring view for CMPivot via the following SQL query using the TaskID:
select * from vSMS_CMPivotStatus where TaskID='{F8C7C37F-B42B-4C0A-B050-2BB44DF1098A}'
Note
For clients that are using version 1810 or higher, state messaging isn't used unless the output is larger than 80 KB. When troubleshooting CMPivot in these cases, you can get more information when you enable verbose logging on your MPs and the site server's SMS_MESSAGE_PROCESSING_ENGINE. For information on how to enable verbose logging, see Site server logging options.
To troubleshoot, refer to the following logs:
MP_Relay.logSMS_MESSAGE_PROCESSING_ENGINE.log
Next steps
Feedback
Coming soon: Throughout 2024 we will be phasing out GitHub Issues as the feedback mechanism for content and replacing it with a new feedback system. For more information see: https://aka.ms/ContentUserFeedback.
Submit and view feedback for