Customers dashboard - Cloud product performance
Appropriate roles: Global admin | Admin agent | Report viewer | Executive report viewer
The Customers dashboard presents data of customers who have either:
Acquired cloud products such as Office, Azure, and Dynamics through you
- or -
Used you to deploy and manage these products in their tenants
The Customers dashboard has the following sections, which are described in this article:
- Summary
- Geographical spread of your customers
- Customer adds and churns
- Customer distribution
- Customers by products breakdown
- Customer distribution trend
- Active customers chart
- Next steps
Summary
The summary section presents a snapshot of various key performance indicators (KPIs) related to your customers, such as:
- Customers
- Active customers
- Subscriptions
- Customers added
- Customers churned
- Customers by each product.
Page-level filters are applicable for each section.
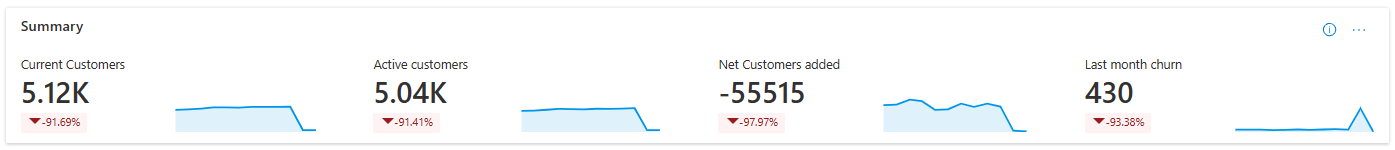
Current customers
- Current count of all customers your organization is associated with through different attribution types across all cloud products, such as Office, Azure, and Dynamics. A customer is counted if they have at least one subscription with Active status.
- Decline percentage (%) of customers during the selected date range
- Micro chart shows month-over-month trend of customers count over the selected date range
Active customers
- Current count of customers with any active product usage, such as active usage on any of the cloud products.
- Growth or decline percentage (%) of active customers during the selected time period
- Micro chart shows a month-over-month trend of active customers count over the selected date range.
Net customers added
- Net count of all customers added during the selected time period. It considers all the customers added and churned (added or lost) during the selected time period.
- Growth or decline percentage (%) of customers added during selected sate range.
- Micro chart shows month-over-month trend of customers added over the selected date range.
Last month churn
- Count of all customers churned during the last month of the selected time period. A customer is considered lost if the customer doesn't have a single subscription with active status.
- Percent of customers churned during the selected date range
- Micro chart shows a month-over-month trend of customers churned over the selected time period
Customers by products
- Current count of customers distributed across the various Cloud products such as Office 365, Azure, and Dynamics.
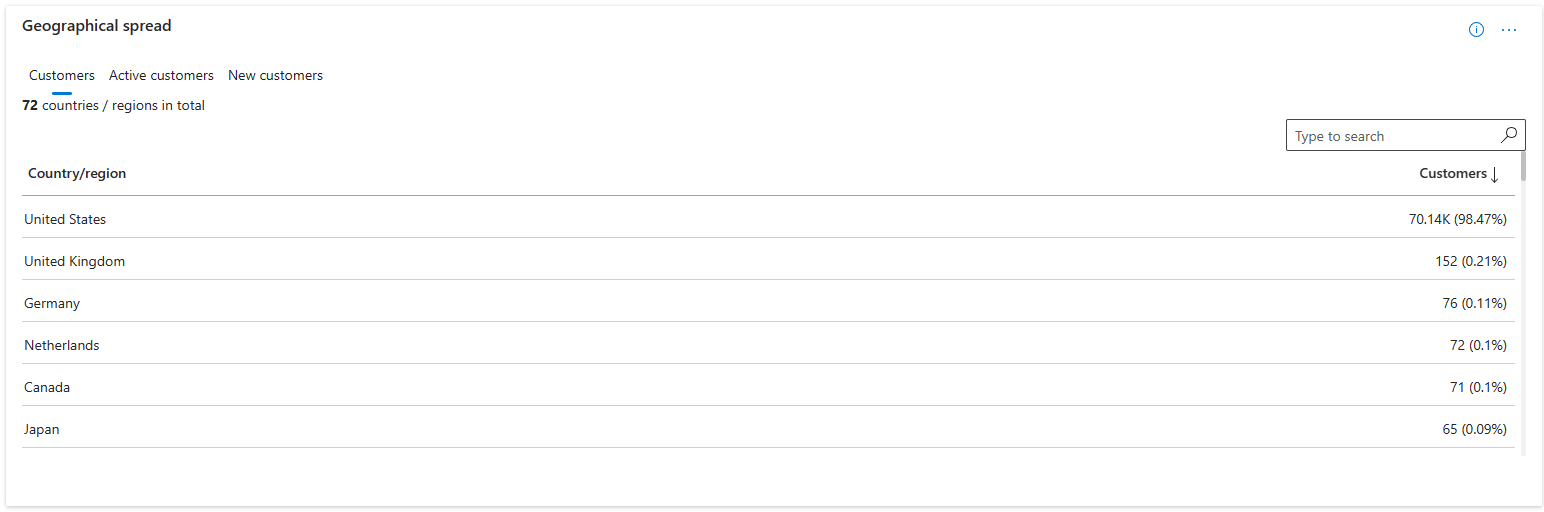
Geographical spread of your customers
Count of current customers, current active customers, and customers newly added during the selected date range are geo-mapped using the customer's country/region. The percentages displayed below the metric indicate the percentage contribution of that country/region of the Total for that metric. You can search and select a country/region in the table. All columns in the table are sortable.
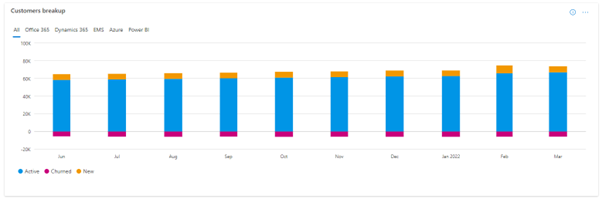
Customer adds and churns
Trend of customers with a breakdown into new, existing, and churned for a selected date range.
- The x axis represents months of the selected date range.
- The y axis represents customer count.
- Churned customers are represented on a negative scale of the y axis.
- A stacked column chart presents a breakdown of new, existing, and churned customers for the month.
- You can rebuild the column chart with specific stack items by selecting them in the legend.
- You can use the slider at the top of the chart to zoom in to a specific period.
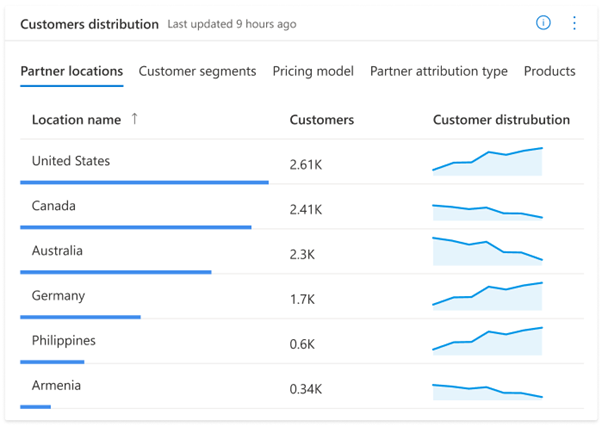
Customer distribution
Breakdown of your current customers by your Microsoft AI Cloud Partner Program locations, customer segments, sales channel/Azure pricing model, and the attribution type.
Select the respective tabs above the chart to view the breakdown by these categories.
You can rebuild the chart by selecting/unselecting specific dimensions by selecting the legend items.
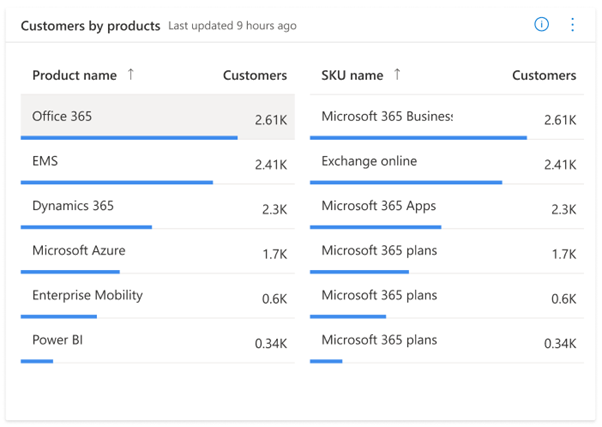
Customers by products breakdown
Breakdown of your current customers count by products and SKUs/plans.
Select a product in the product breakdown pie chart to view the breakdown by SKUs/plans in the chart next to it.

Customer distribution trend
Monthly trend of the distribution of your customers during the selected date range by markets, segments, your Microsoft AI Cloud Partner Program locations, and products they've acquired.
Select the respective tabs in the chart to view the trend by these categories.
- X-axis represents the months for the date range you've selected.
- Y-axis has the count of customers for the selected category (tab selection).
You can hover over the chart columns to view the values breakdown of each stack.
You can use the slider at the top of the chart to zoom in to data about a particular period.
Active customers chart
Monthly trend chart comparing active and total customers for the selected date range. Columns represent active customer counts each month and the line represents total customers each month.

Next steps
For more reports, see Using the Partner Center Insights unified dashboard.
Note
You can download this report's raw data from the Download Reports section of the Insights workspace. To learn more, see Download reports
Feedback
Coming soon: Throughout 2024 we will be phasing out GitHub Issues as the feedback mechanism for content and replacing it with a new feedback system. For more information see: https://aka.ms/ContentUserFeedback.
Submit and view feedback for