Dynamics usage dashboard - Cloud product performance
Appropriate roles: Global admin | Admin agent | Report viewer | Executive report viewer
The Dynamics usage report provides usage data for the Microsoft Dynamics 365 subscriptions that you sold or manage for your customers. You can view the following sections from the dynamics usage report:
- Summary
- Dynamics usage by geography
- Dynamics usage by SKU
- Subscriptions performance
- Dynamics usage distribution
Note
This report is available from the Insights dashboard. To view this report, you must be assigned any of the following roles in Partner Center: Global admin, Account admin, Report viewer, or Executive report viewer. For more information, see your company's Global admin. Specific types of data in this report might also only be available to users with Executive report viewer privileges.
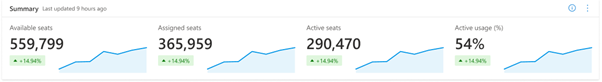
Summary
The Summary section presents a snapshot view of the key indicators related to Dynamics usage subscriptions that you sold or manage for your customers.
Available seats: Total number of licenses sold during the selected time frame.
The spark line chart presents a month-over-month trend of available seats count for your selected date range.
Assigned seats: Total number of licenses assigned during the selected time frame.
The spark line chart presents a month-over-month trend of the assigned seats count during your selected date range.
Active seats: Total number of licenses that had usage during the selected time frame.
The spark line chart presents a monthly trend of monthly active seats over the selected time period.
Note
You might see that the Active seats number is more than the Assigned seats. It is because Active seats considers the trial users too which isn't included in the Assigned seats.
Active Usage %: Total number of active seats expressed as a percentage of the available seats for the selected time frame.
The spark line chart presents a monthly trend of active usage percentage over the selected time period.
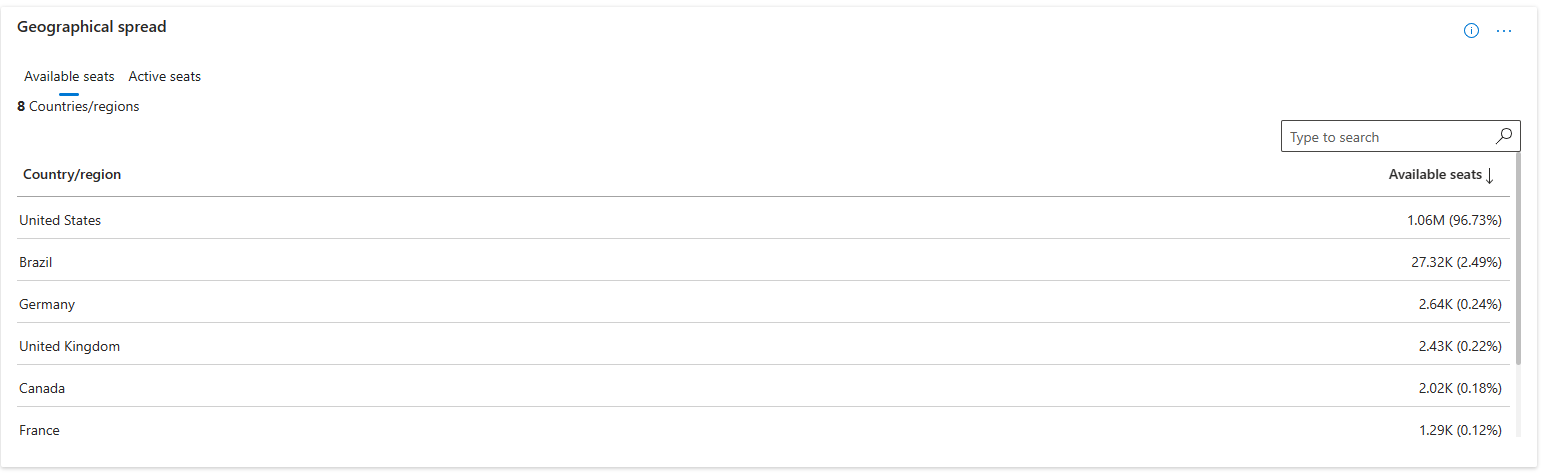
Dynamics usage by geography
This view gives geographical distribution of Dynamics usage for Available seats and Active seats. Switch between the tabs to view the numbers for different countries/regions.
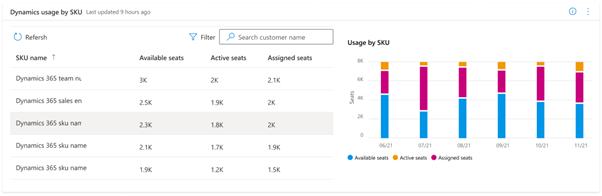
Dynamics usage by SKU
The Dynamics usage by SKU section depicts monthly trend of available seats, active seats, and assigned seats by SKUs.
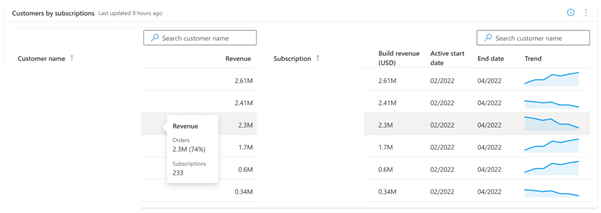
Subscriptions performance
The Subscriptions performance section depicts the monthly trend of Active Usage per customer subscription. Data for the top 100 customers by billed revenue is shown in the table and you can search for any customer or download the raw data to view details for all subscriptions.
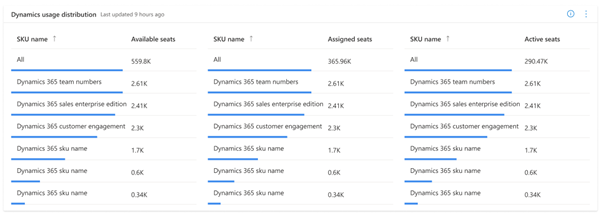
Dynamics usage distribution
The Dynamics usage distribution section depicts the breakdown of available seats, active seats, and assigned seats by SKUs.
Next steps
- For more reports, see Partner Center Insights.
- You can download the raw data powering this report from the Download Reports section in the Insights dashboard.
Feedback
Coming soon: Throughout 2024 we will be phasing out GitHub Issues as the feedback mechanism for content and replacing it with a new feedback system. For more information see: https://aka.ms/ContentUserFeedback.
Submit and view feedback for