Co-debug in a collaboration session in Visual Studio Code
The Visual Studio Live Share collaborative debugging feature is a powerful way to debug a problem. It enables a collaborative experience to troubleshoot problems. It also gives you and other participants in your session the ability to investigate problems that might be environment specific by providing a shared debugging session on the host's computer.
Tip
Because participants can independently go to and edit files, as a host, you might want to restrict which files guests are able to access in your project via a .vsls.json file. You should also be aware that Console/REPL access enables participants to run commands on your computer, so you should only co-debug with people you trust. Guests should realize that, because of restrictive settings, they might not be able to follow the debugger as it steps into certain restricted files. For more information, see Controlling file access and visibility.
Using collaborative debugging is simple.
Be sure the host and all guests have the appropriate debugging extension installed. Installation isn't always necessary, but it's generally a good idea.
The host, if not already set up for the project, should configure launch.json to debug the application from Visual Studio Code as normal. No special setup is required.
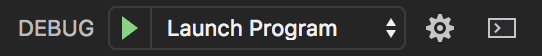
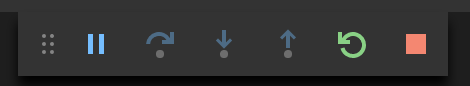
The host can start debugging by using the button on the debug tab, as normal:
Tip
You can also participate in Visual Studio debugging sessions from Visual Studio Code, and vice versa. For more information, see the Visual Studio instructions for co-debugging.
When the debugger attaches on the host's side, all guests are also automatically attached. There's one debugging session running on the host's computer, but all participants are connected to it and have their own view:
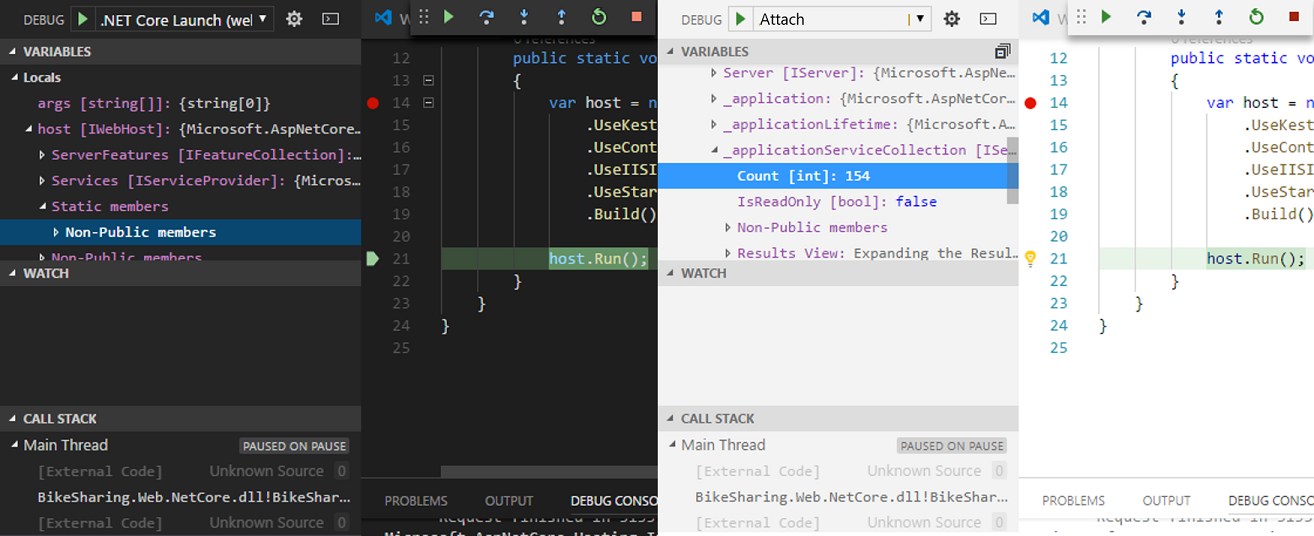
Anyone can step through the debugging process, so you can switch among collaborators without having to negotiate control.
Note
See Platform support for information about debugging feature support by language or platform.
Each collaborator can investigate variables, go to various files in the call stack, inspect variables, and even add or remove breakpoints. Co-editing features allow each participant to track where the others are located so they can switch between concurrently investigating aspects of the problem and collaboratively debugging.
Note
In a read-only collaboration session, guests won't be able to step through the debugging process. They can add or remove breakpoints and inspect variables.
Change when Visual Studio Code joins debugging sessions
By default, as a guest, you'll be automatically attached to debugging sessions when they're shared by the host. You might find this behavior disruptive.
To change this behavior, open the Help menu in the lower left corner and select Configure Settings.
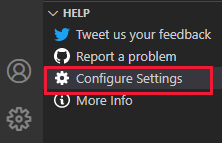
Scroll down to Live Share: Join Debug Session Option, and select one of the following options:
| Setting | Behavior |
|---|---|
| Automatic | The default. As a guest, you'll automatically join any shared debugging session the host starts. |
| Prompt | As a guest, you're prompted to join a shared debugging session when it's started by the host. |
| Manual | As a guest, you'll need to manually join debugging sessions. See Detaching and reattaching. |
Detaching and reattaching
As a guest, you might want to stop debugging temporarily. You can select the Stop button on the debug toolbar to detach the debugger without affecting the host or other guests:
If you've updated your settings so you don't automatically attach, or if you want to reattach later, you can do so by selecting Ctrl+Shift+P or Cmd+Shift+P or selecting the session state status bar item and then selecting Attach to a Shared Debugging Session:

Share the running application in a browser
Unlike Visual Studio, Visual Studio Code doesn't support known web application ports for project types like ASP.NET. But if you're joining a collaboration session from a Visual Studio host, you might automatically see your default browser appear when debugging starts. The browser is then automatically connected to the host's running applications. For more information, see Visual Studio features.
As a host, you can achieve something similar by manually sharing the application, or other endpoints like RESTful services, by using the Share Local Server feature. Visual Studio and Visual Studio Code guests can then open a browser on the same localhost port to see the running application. For more information, see Share a server.
Next steps
Feedback
Coming soon: Throughout 2024 we will be phasing out GitHub Issues as the feedback mechanism for content and replacing it with a new feedback system. For more information see: https://aka.ms/ContentUserFeedback.
Submit and view feedback for