Work with the Python Interactive window
Applies to: ![]() Visual Studio
Visual Studio ![]() Visual Studio for Mac
Visual Studio for Mac
Note
This article applies to Visual Studio 2017. If you're looking for the latest Visual Studio documentation, see Visual Studio documentation. We recommend upgrading to the latest version of Visual Studio. Download it here
Visual Studio provides an interactive read-evaluate-print loop (REPL) window for each of your Python environments, which improves upon the REPL you get with python.exe on the command line. The Interactive window (opened with the View > Other Windows > <environment> Interactive menu commands) lets you enter arbitrary Python code and see immediate results. This way of coding helps you learn and experiment with APIs and libraries, and to interactively develop working code to include in your projects.
Visual Studio has a number of Python REPL modes to choose from:
| REPL | Description | Editing | Debugging | Images |
|---|---|---|---|---|
| Standard | Default REPL, talks to Python directly | Standard editing (multiline, etc.). | Yes, via $attach |
No |
| Debug | Default REPL, talks to debugged Python process | Standard editing | Only debugging | No |
| IPython | REPL talks to IPython backend | IPython commands, Pylab conveniences | No | Yes, inline in REPL |
| IPython w/o Pylab | REPL talks to IPython backend | Standard IPython | No | Yes, separate window |
This article describes the Standard and Debug REPL modes. For details on IPython modes, see Use the IPython REPL.
For a detailed walkthrough with examples, including the interactions with the editor such as Ctrl+Enter, see Tutorial Step 3: Use the Interactive REPL window.
Open an Interactive window
There are several ways to open the Interactive window for an environment.
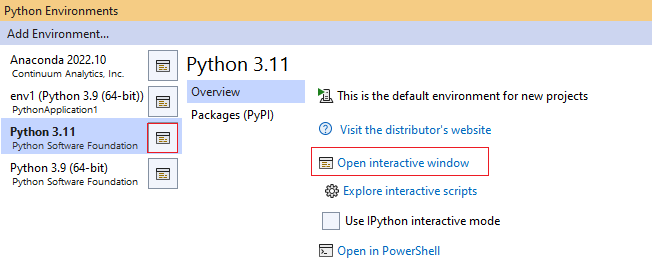
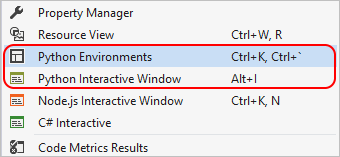
First, switch to the Python Environments window (View > Other Windows > Python Environments or Ctrl+K > Ctrl+`) and select the Open Interactive Window command or button for a chosen environment.
Second, near the bottom of the View > Other Windows menu, there's a Python Interactive Window command for your default environment, as well as a command to switch to the Environments window:
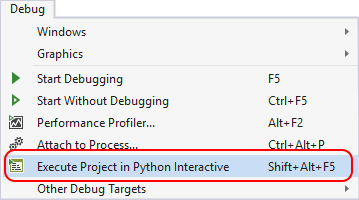
Third, you can open an Interactive window on the startup file in your project, or for a stand-alone file, by selecting the Debug > Execute <Project | File> in Python Interactive menu command (Shift+Alt+F5):
Finally, you can select code in file and use the Send to Interactive command described below.
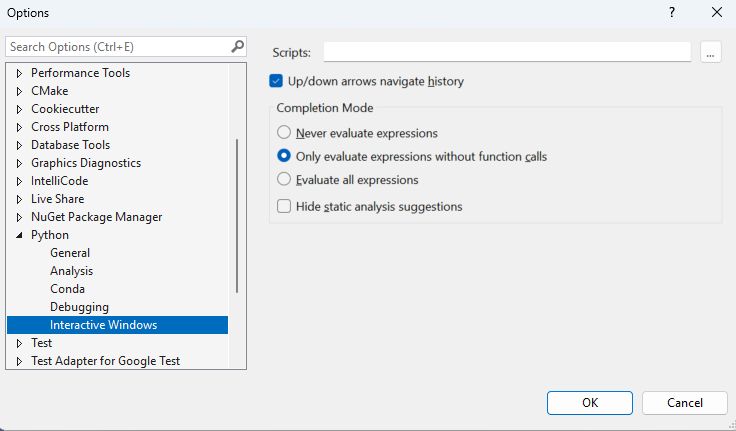
Interactive window options
You can control various aspects of the Interactive window through Tools > Options > Python > Interactive Windows (see Options):
Use the Interactive window
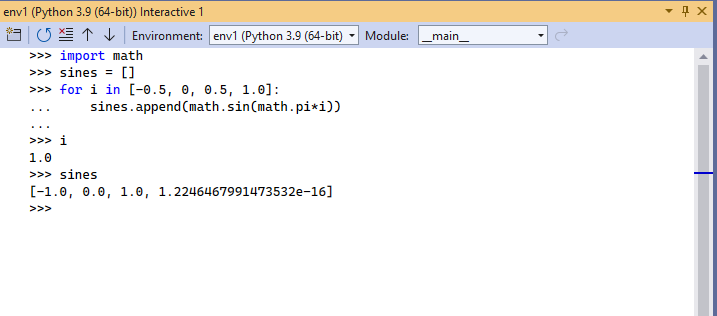
Once the Interactive window is open, you can start entering code line-by-line at the >>> prompt. The Interactive window executes each line as you enter it, which includes importing modules, defining variables, and so on:
The exception is when additional lines of code are needed to make a complete statement, such as when a for statement ends in a colon as shown above. In these cases, the line prompt changes to ... indicating that you need to enter additional lines for the block, as shown on the fourth and fifth lines in the graphic above. When you press Enter on a blank line, the Interactive window closes the block and runs it in the interpreter.
Tip
The Interactive window improves upon the usual Python command-line REPL experience by automatically indenting statements that belong to a surrounding scope. Its history (recalled with the up arrow) also provides multiline items, whereas the command-line REPL provides only single lines.
The Interactive window also supports several meta-commands. All meta-commands start with $, and you can type $help to get a list of the meta-commands and $help <command> to get usage details for a specific command.
| Meta-command | Description |
|---|---|
$$ |
Inserts a comment, which is helpful to comment code throughout your session. |
$attach |
Attaches the Visual Studio debugger to the REPL window process to enable debugging. |
$cls, $clear |
Clears the contents of the editor window, leaving history and execution context intact. |
$help |
Display a list of commands, or help on a specific command. |
$load |
Loads commands from file and executes until complete. |
$mod |
Switches the current scope to the specified module name. |
$reset |
Resets the execution environment to the initial state, but keeps history. |
$wait |
Waits for at least the specified number of milliseconds. |
Commands are also extensible by Visual Studio extensions by implementing and exporting IInteractiveWindowCommand (example).
Switch scopes
By default, the Interactive window for a project is scoped to the project's startup file as if you ran it from the command prompt. For a stand-alone file, it scopes to that file. At any time during your REPL session, however, the drop-down menu along the top of the Interactive window lets you change scope:
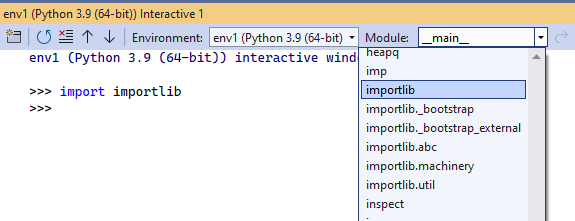
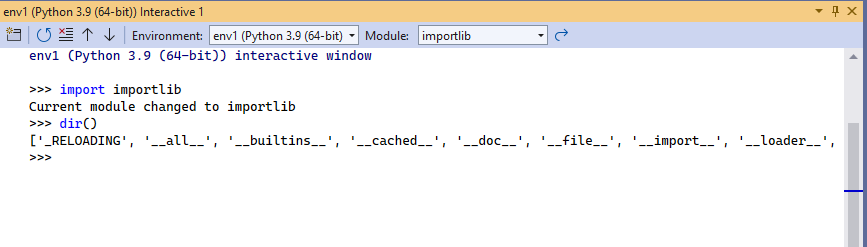
Once you import a module, such as typing import importlib, options appear in the drop-down to switch into any scope in that module. A message in the Interactive window also indicates the new scope, so you can track how you got to a certain state during your session.
Entering dir() in a scope displays valid identifiers in that scope, including function names, classes, and variables. For example, using import importlib followed by dir() shows the following:
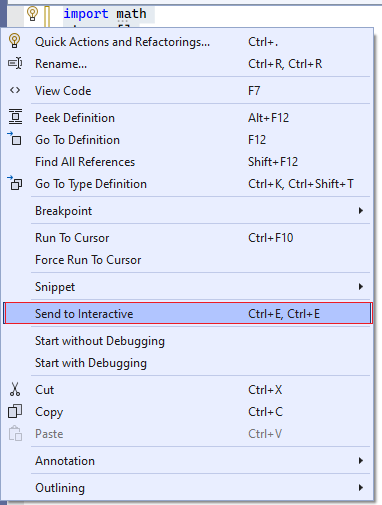
Send to Interactive command
In addition to working within the Interactive window directly, you can select code in the editor, right-click, and choose Send to Interactive or press Ctrl+Enter.
This command is useful for iterative or evolutionary code development, including testing your code as you develop it. For example, once you've sent a piece of code to the Interactive window and seen its output, you can press the up arrow to show the code again, modify it, and test it quickly by pressing Ctrl+Enter. (Pressing Enter at the end of input executes it, but pressing Enter in the middle of input inserts a newline.) Once you have the code you want, you can easily copy it back into your project file.
Tip
By default, Visual Studio removes >>> and ... REPL prompts when pasting code from the Interactive window into the editor. You can change this behavior on the Tools > Options > Text Editor > Python > Advanced tab using the Paste removes REPL prompts option. See Options - Miscellaneous options.
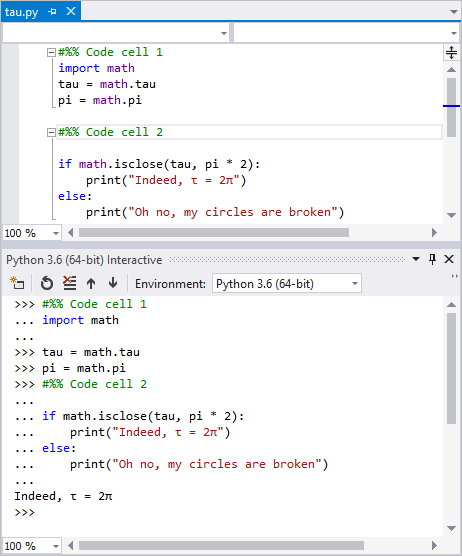
Work with code cells
Code cells can be used in data analysis and are supported by a variety of text editors.
For example, when using a code file as a scratchpad, you often have a small block of code you want to send all at once. To group code together, mark the code as a code cell by adding a comment starting with #%% to the beginning of the cell, which ends the previous one. Code cells can be collapsed and expanded, and using Ctrl+Enter inside a code cell sends the entire cell to the Interactive window and moves to the next one.
Visual Studio also detects code cells starting with comments like # In[1]:, which is the format you get when exporting a Jupyter notebook as a Python file. This detection makes it easy to run a notebook from Azure Notebooks by downloading as a Python file, opening in Visual Studio, and using Ctrl+Enter to run each cell.
IntelliSense behavior
The Interactive window includes IntelliSense based on the live objects, unlike the code editor in which IntelliSense is based on source code analysis only. These suggestions are more correct in the Interactive window, especially with dynamically generated code. The drawback is that functions with side-effects (such as logging messages) may impact your development experience.
If this behavior is a problem, change the settings under Tools > Options > Python > Interactive Windows in the Completion Mode group, as described on Options - Interactive windows options.