Debug and analyze unit tests with Test Explorer
You can use Test Explorer to start a debugging session for your tests. Stepping through your code with the Visual Studio debugger seamlessly takes you back and forth between the unit tests and the project under test. To start debugging:
In the Visual Studio editor, set a breakpoint in one or more test methods that you want to debug.
Note
Because test methods can run in any order, set breakpoints in all the test methods that you want to debug.
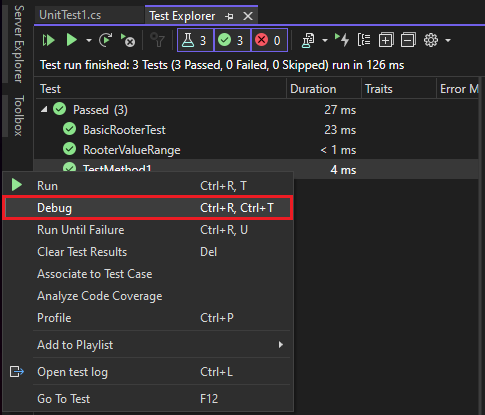
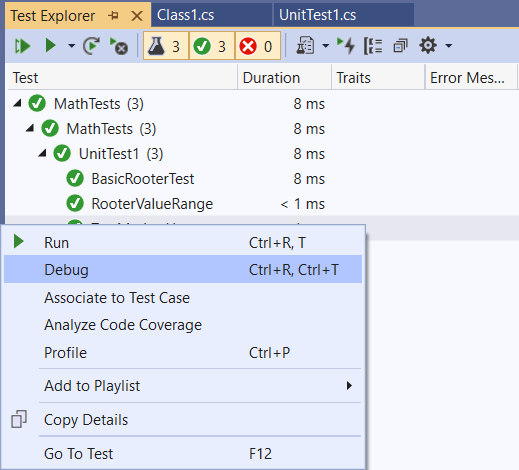
In Test Explorer, select the test method(s) and then choose Debug on the right-click menu.
For more information, about the debugger, see Debug in Visual Studio.
Diagnose test method performance issues
Starting in Visual Studio 2022 version 17.8, you can use any applicable tool in the Performance Profiler to help improve your code, and not just the Instrumentation tool. You can profile small units of work in isolation, make changes, and then remeasure and validate the impact of the change.
To diagnose why a test method is taking more time than you'd like, or using more memory than you'd like, select the method in Test Explorer and then choose Profile on the right-click menu. The Performance Profiler opens and you can select a profiling tool to test your code. For more information, see this blog post or see Collect profiling data without debugging.
To diagnose why a test method is taking too much time, select the method in Test Explorer and then choose Profile on the right-click menu. See Instrumentation profiling report.
Note
This feature is not currently supported for .NET Core.
Related content
Feedback
Coming soon: Throughout 2024 we will be phasing out GitHub Issues as the feedback mechanism for content and replacing it with a new feedback system. For more information see: https://aka.ms/ContentUserFeedback.
Submit and view feedback for