Tutorial: Visualize real-time sensor data from Azure IoT Hub using Power BI
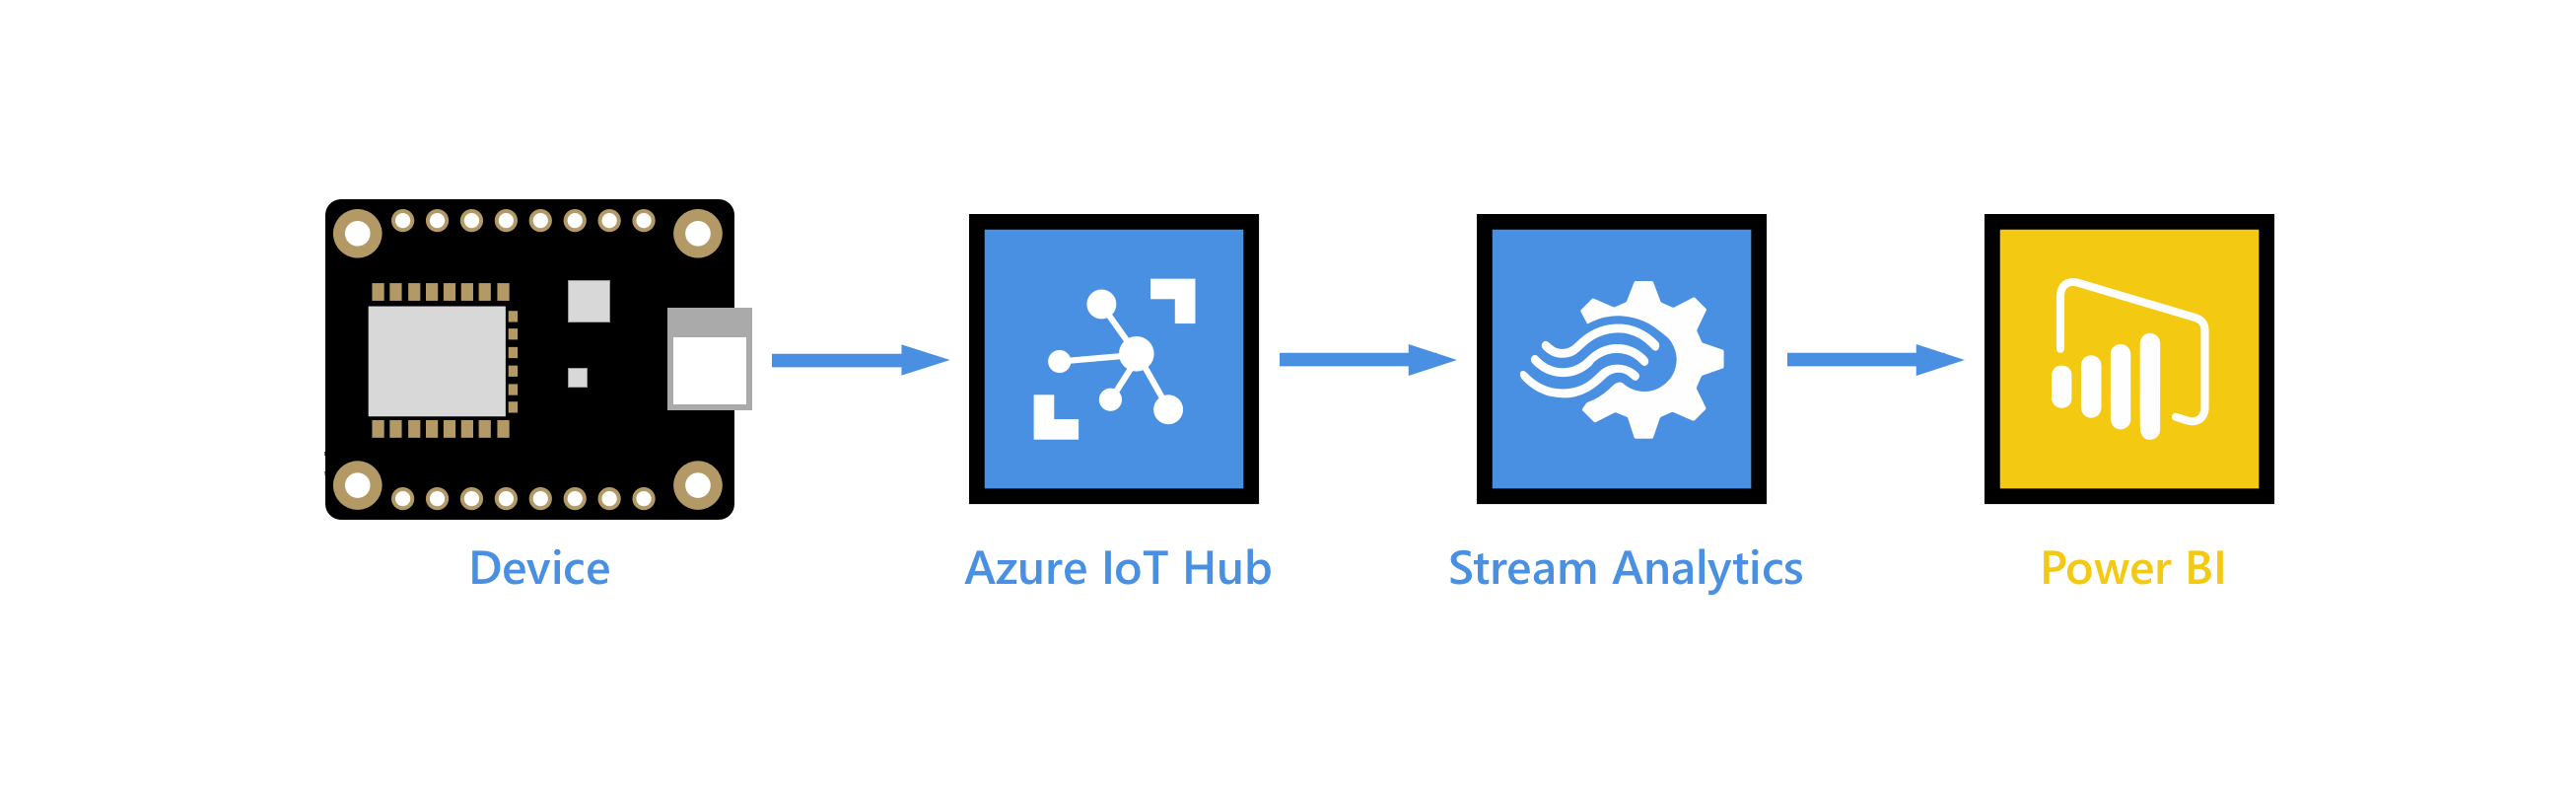
You can use Microsoft Power BI to visualize real-time sensor data that your Azure IoT hub receives. To do so, configure an Azure Stream Analytics job to consume the data from IoT Hub and route it to a dataset in Power BI.
Microsoft Power BI is a data visualization tool that you can use to perform self-service and enterprise business intelligence (BI) over large data sets. Azure Stream Analytics is a fully managed, real-time analytics service designed to help you analyze and process fast moving streams of data that can be used to get insights, build reports or trigger alerts and actions.
In this tutorial, you perform the following tasks:
- Create a consumer group on your IoT hub.
- Create and configure an Azure Stream Analytics job to read temperature telemetry from your consumer group and send it to Power BI.
- Create a report of the temperature data in Power BI and share it to the web.
If you don't have an Azure subscription, create a free account before you begin.
Prerequisites
Before you begin this tutorial, have the following prerequisites in place:
Complete one of the Send telemetry quickstarts in the development language of your choice. Alternatively, you can use any device app that sends temperature telemetry; for example, the Raspberry Pi online simulator or one of the Embedded device tutorials. These articles cover the following requirements:
- An active Azure subscription.
- An Azure IoT hub in your subscription.
- A client app that sends messages to your Azure IoT hub.
A Power BI account. Try Power BI for free.
Add a consumer group to your IoT hub
Consumer groups provide independent views into the event stream that enable apps and Azure services to independently consume data from the same Event Hub endpoint. In this section, you add a consumer group to your IoT hub's built-in endpoint that is used later in this tutorial to pull data from the endpoint.
To add a consumer group to your IoT hub, follow these steps:
In the Azure portal, open your IoT hub.
On the left pane, select Built-in endpoints. Enter a name for your new consumer group in the text box under Consumer groups.
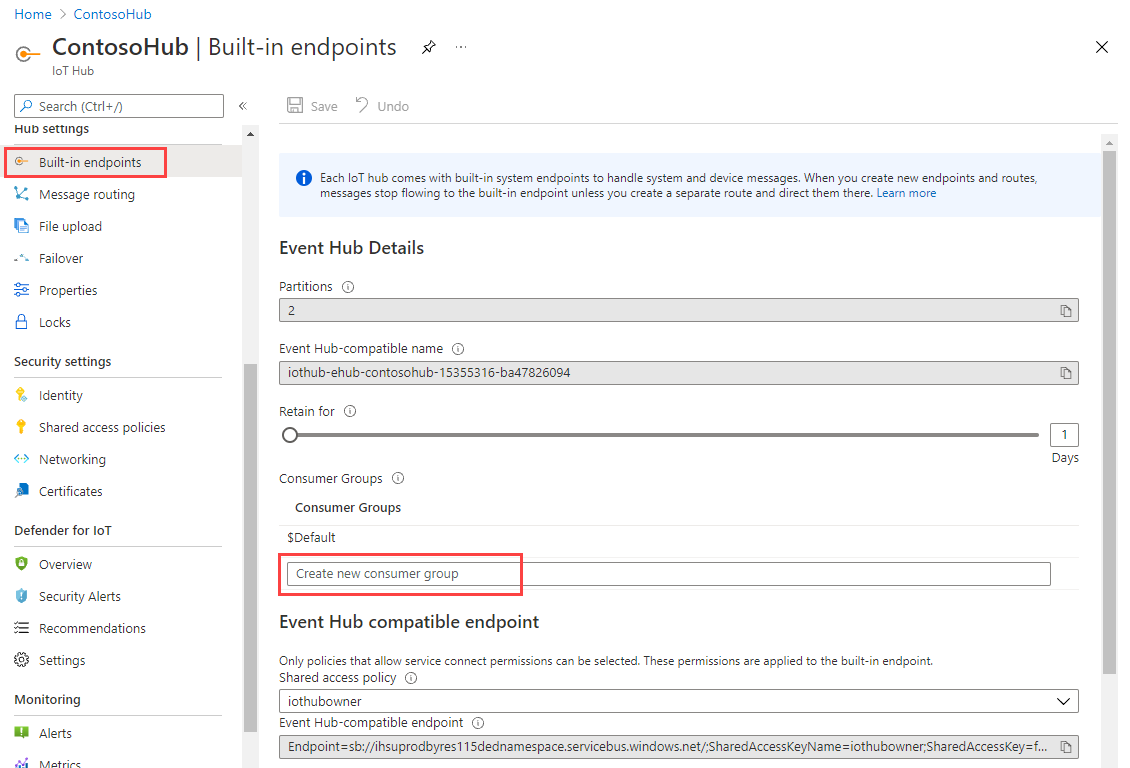
Click anywhere outside the text box to save the consumer group.
Create, configure, and run a Stream Analytics job
Create a Stream Analytics job. After you create the job, you define the inputs, outputs, and the query used to retrieve the data.
Create a Stream Analytics job
Create a Stream Analytics job that you'll use to route data from IoT Hub to Power BI.
In the Azure portal, select Create a resource. Type Stream Analytics Job in the search box and select it from the drop-down list. On the Stream Analytics job overview page, select Create
In the Basics tab of the New Stream Analytics job page, enter the following information:
Parameter Value Subscription Select the subscription that contains your IoT hub. Resource group Select the resource group that contains your IoT hub. Name Enter the name of the job. The name must be globally unique. Region Select the region where your IoT hub is located. Leave all other fields at their defaults.
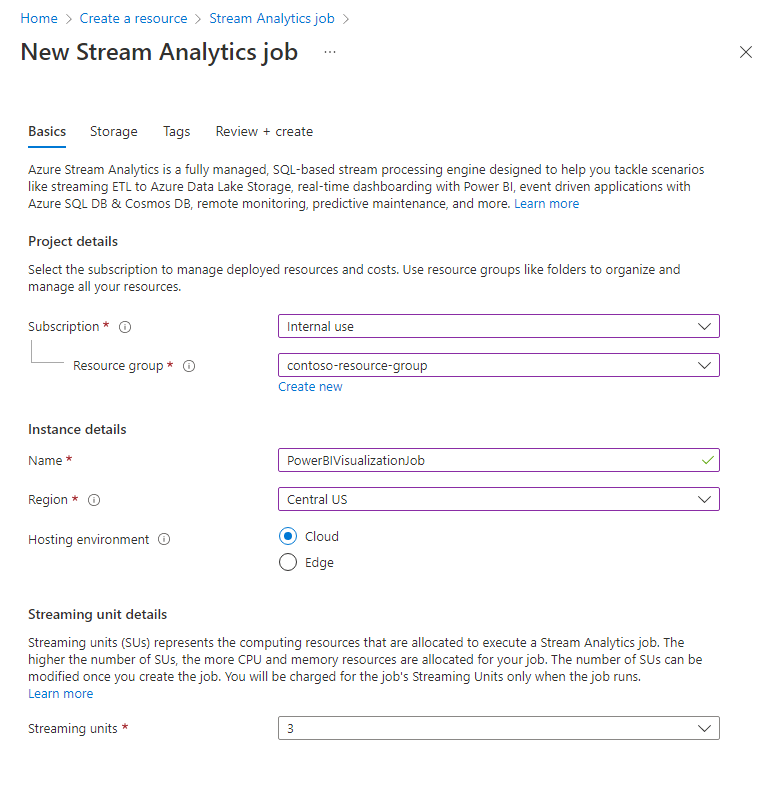
Select Review + create, then select Create to create the Stream Analytics job.
Once the job is created, select Go to resource.
Add an input to the Stream Analytics job
Configure the Stream Analytics job to collect data from your IoT hub.
Open the Stream Analytics job.
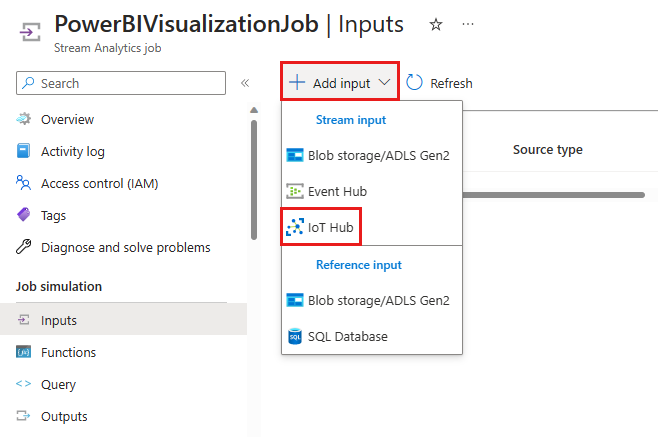
Select Inputs from the Job simulation section of the navigation menu.
Select Add input, then select IoT Hub from the drop-down list.
On the new input pane, enter the following information:
Parameter Value Input alias Enter a unique alias for the input. For example, PowerBIVisualizationInput.Subscription Select the Azure subscription you're using for this tutorial. IoT Hub Select the IoT hub you're using for this tutorial. Consumer group Select the consumer group you created previously. Shared access policy name Select the name of the shared access policy you want the Stream Analytics job to use for your IoT hub. For this tutorial, you can select service. The service policy is created by default on new IoT hubs and grants permission to send and receive on cloud-side endpoints exposed by the IoT hub. To learn more, see Access control and permissions. Shared access policy key This field is automatically filled, based on your selection for the shared access policy name. Endpoint Select Messaging. Leave all other fields at their defaults.
Select Save.
Add an output to the Stream Analytics job
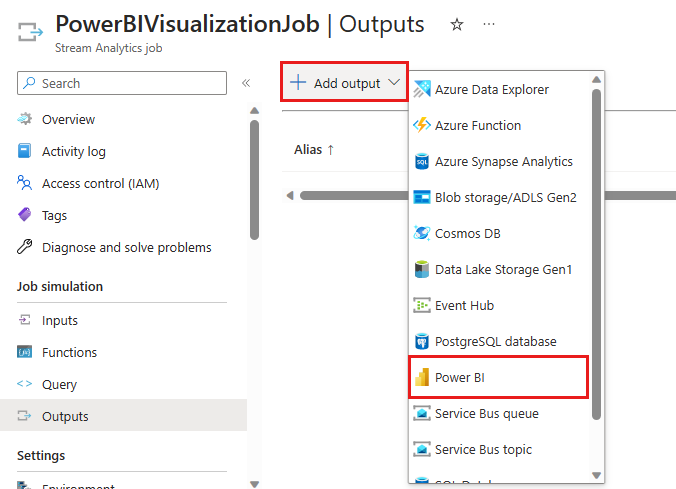
Select Outputs from the Job simulation section of the navigation menu.
Select Add output, and then select Power BI from the drop-down list.
After you've signed in to Power BI, enter the following information to create a Power BI output:
Parameter Value Output alias A unique alias for the output. For example, PowerBIVisualizationOutput.Group workspace Select your target group workspace. Authentication mode The portal warns you if you don't have the correct permissions to use managed identities for authentication. If that's the case, select User token instead. Dataset name Enter a dataset name. Table name Enter a table name. Select Authorize and sign in to your Power BI account.
Select Save.
Configure the query of the Stream Analytics job
Select Query from the Job simulation section of the navigation menu.
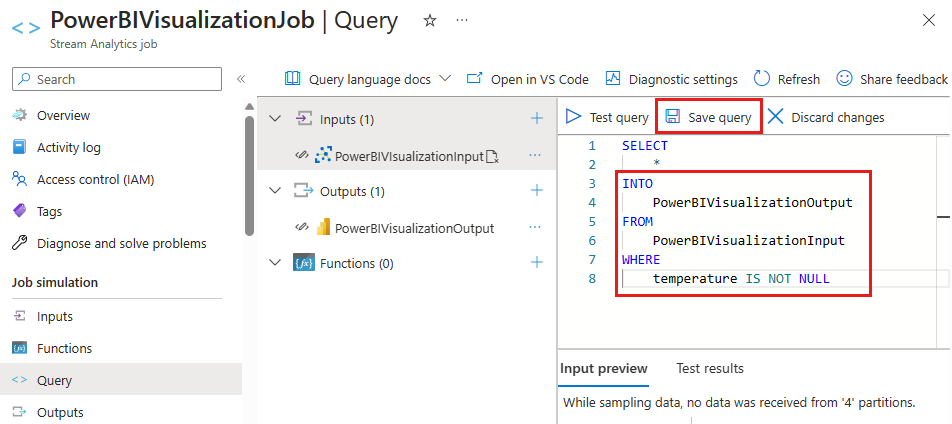
In the query editor, replace
[YourOutputAlias]with the output alias of the job.Replace
[YourInputAlias]with the input alias of the job.Add the following
WHEREclause as the last line of the query. This line ensures that only messages with a temperature property will be forwarded to Power BI.WHERE temperature IS NOT NULLYour query should look similar to the following screenshot. Select Save query.
Run the Stream Analytics job
- In the Stream Analytics job, select Overview.
- Select Start > Now > Start. Once the job successfully starts, the job status changes from Stopped to Running.
Create and publish a Power BI report to visualize the data
The following steps show you how to create and publish a report using the Power BI service.
Make sure that your IoT device is running and sending temperature data to IoT hub.
Sign in to your Power BI account.
Select Workspaces from the side menu, then select the group workspace you chose in the Stream Analytics job output.
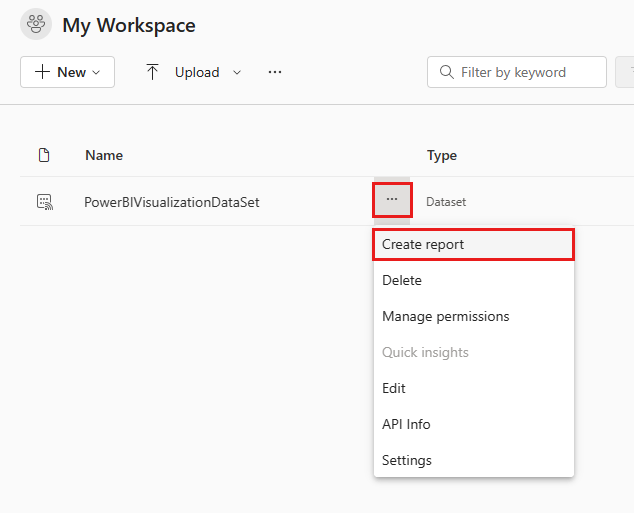
On your workspace view, you should see the dataset that you specified when you created the output for the Stream Analytics job.
Hover over the dataset you created, select More options menu (the three dots to the right of the dataset name), and then select Create report.
Create a line chart to show real-time temperature over time.
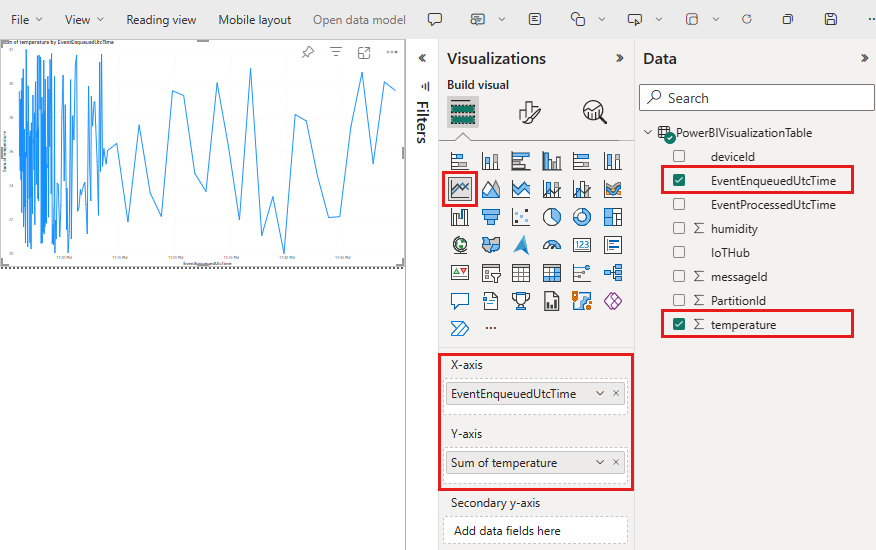
On the Visualizations pane of the report creation page, select the line chart icon to add a line chart. Use the guides located on the sides and corners of the chart to adjust its size and position.
On the Fields pane, expand the table that you specified when you created the output for the Stream Analytics job.
Drag EventEnqueuedUtcTime to X Axis on the Visualizations pane.
Drag temperature to Y Axis.
A line chart is created. The x-axis displays date and time in the UTC time zone. The y-axis displays temperature from the sensor.
Note
Depending on the device or simulated device that you use to send telemetry data, you may have a slightly different list of fields.
Select File > Save to save the report. When prompted, enter a name for your report.
Still on the report pane, select File > Embed report > Website or portal.
Note
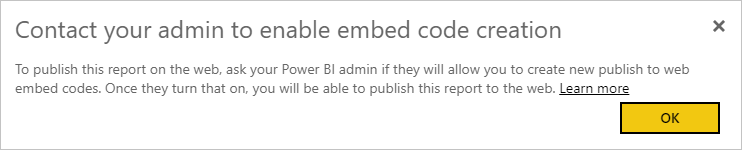
If you get a notification to contact your administrator to enable embed code creation, you may need to contact them. Embed code creation must be enabled before you can complete this step.
You're provided the report link that you can share with anyone for report access and a code snippet that you can use to integrate the report into a blog or website. Copy the link in the Secure embed code window and then close the window.
Open a web browser and paste the link into the address bar to view your report in the browser.
Microsoft also offers the Power BI mobile apps for viewing and interacting with your Power BI dashboards and reports on your mobile device.
Clean up resources
In this tutorial, you created a Stream Analytics job and a dataset in Power BI.
If you plan to complete other tutorials, you may want to keep the resource group and IoT hub, so you can reuse them later.
Clean up Azure resources
Your Stream Analytics job should be in the same resource group as your IoT hub. If you don't need the IoT hub or the other resources you created any longer, you can delete the entire resource group in the Azure portal. Or, you can delete individual resources.
- In the Azure portal, navigate to your resource group.
- Review the resources in your group. If you want to delete them all, select Delete resource group. If you want to delete an individual resource, right-click the resource, select Delete from the context menu, and follow the prompts.
To remove the resource group and all of its resources, you can also use the az group delete command:
az group delete --name {your resource group}
Clean up Power BI resources
You created a dataset, PowerBiVisualizationDataSet, in Power BI. You can delete your dataset and the associated report you created from the Power BI service.
- Sign in to your Power BI account.
- Select Workspaces, then select the name of the workspace that contains your dataset.
- Hover over the PowerBiVisualizationDataSet dataset and select the three horizontal dots that appear to open the More options menu.
- Select Delete and follow the prompts. When you remove the dataset, the report is removed as well.
Next steps
In this tutorial, you learned how to use Power BI to visualize real-time sensor data from your Azure IoT hub.
For another way to visualize data from Azure IoT Hub, see the following tutorial:
Feedback
Coming soon: Throughout 2024 we will be phasing out GitHub Issues as the feedback mechanism for content and replacing it with a new feedback system. For more information see: https://aka.ms/ContentUserFeedback.
Submit and view feedback for