Building blocks of Power BI
The building blocks of Power BI are semantic models and visualizations. Create a semantic model and then use visuals to build a report. Let's explore these items in more detail and how they relate to the flow of Power BI.
Create a semantic model
A semantic model consists of all connected data, transformations, relationships, and calculations. To follow the flow of Power BI, you first connect to data, transform data, and create relationships and calculations to create a semantic model.
First, connect to as many data sources you need. Then clean and transform the data to your needs. Add relationships between tables and calculations to extend the semantic model. After all of that, now you can create a report.
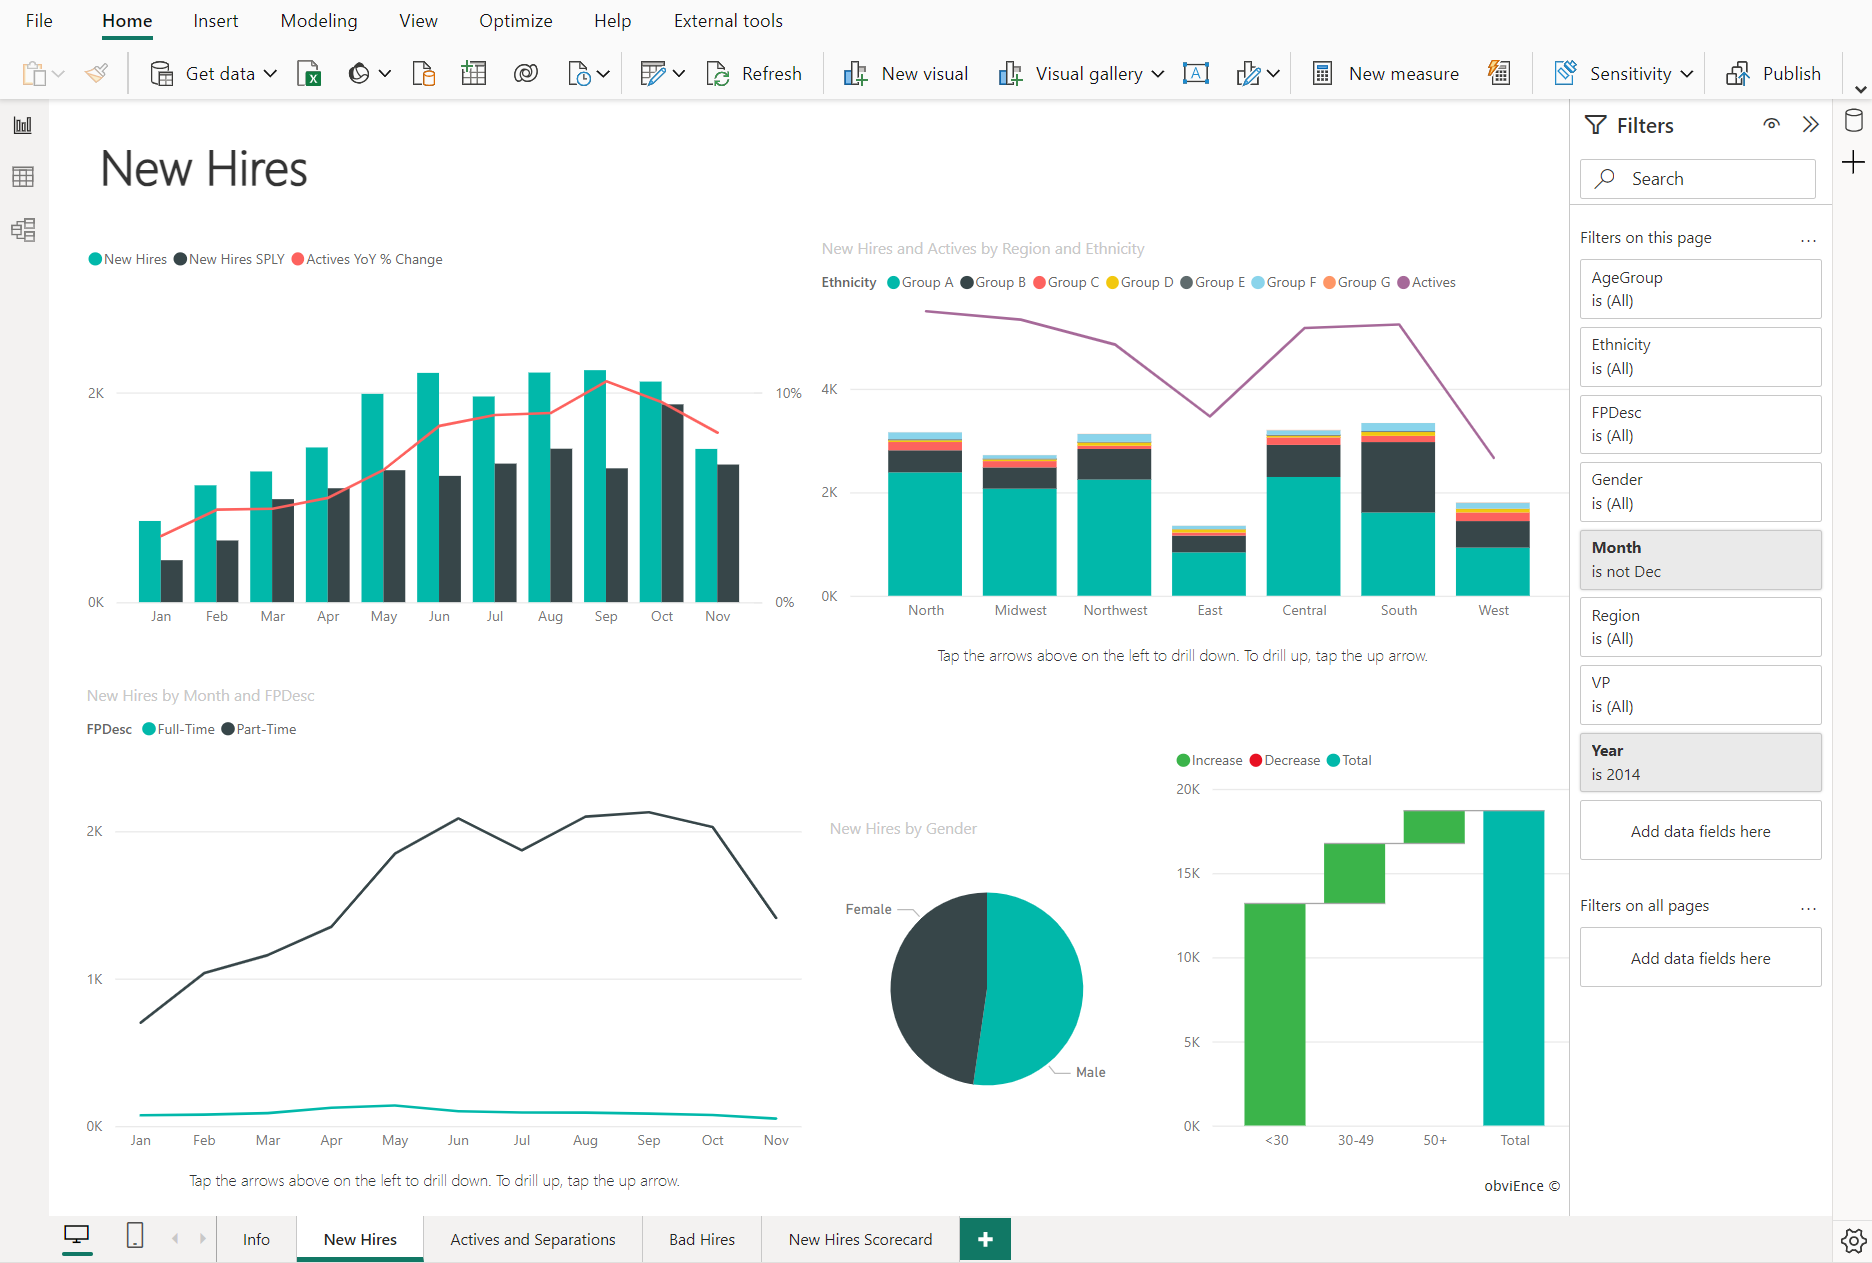
Create visualizations in a report
In Power BI Desktop, when you create a visualization (also called visual), you add it to the canvas for a report page. Choose your visualizations to build pages in your report. It's ideal to keep each page simple with related data, so consumers can easily see the insights.
Power BI is a low-code solution, which means that you can "drag and drop" data field directly onto the canvas. Power BI will choose a visual for your data field. You can easily change between visuals for the same fields, and add or remove data fields to the visual.
One of the most valuable features of Power BI reports is the interactivity between visuals. Consumers can select different data points in the visual and see how that affects the other visuals. Depending on your design, they can also drillthrough from one visual to more detail or filter based on different fields in the report.
Once you're satisfied with your report, you publish it to the Power BI service.
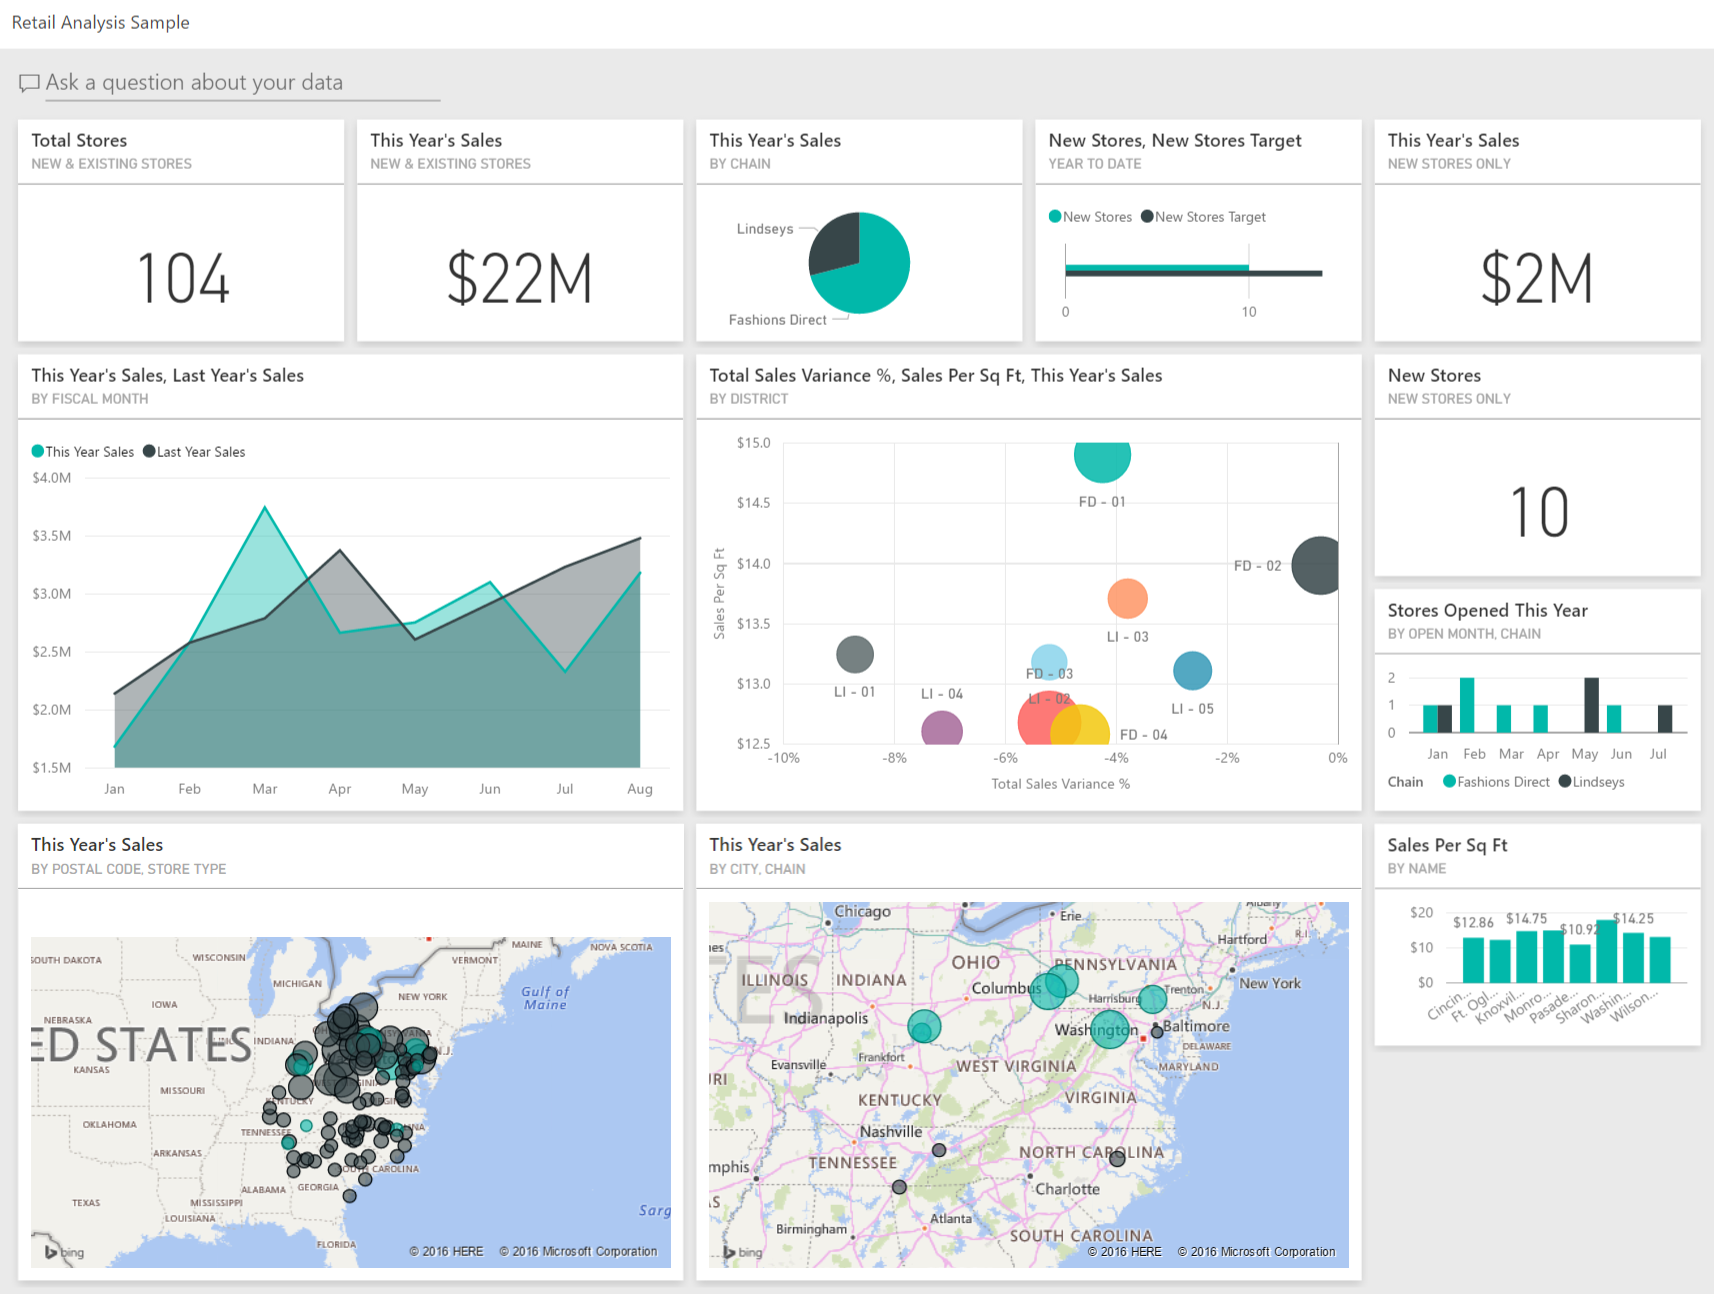
Create a dashboard
In the Power BI service, you can also create dashboards after you've published a report. Dashboards consist of a single page made up of tiles. Add tiles to a dashboard by pinning a visual in a report to the dashboard. Tiles aren't interactive like visuals, so when a user interacts with the tile, they go to the underlying report for more information.
Dashboards are an excellent way to provide high-level information to consumers. Similar to a dashboard in a vehicle, include the most important information in a dashboard. Then consumers can go to the report for more details.
To recap, the building blocks of Power BI are semantic models and visuals. Using Power BI Desktop, you create the semantic model and use visuals to create reports.
In the Power BI service, you can distribute content to your consumers and use reports to create dashboards.