Warning threashold in Charts

TTLAzure 1 Reputation point
2020-06-02T23:42:15.98+00:00

Hello,

I am planning to add a warning threashold to Responsetime chart by using "SLA"

i am using below query, but when i add this chart to dashboard, i am unable to see the SLA line(warning line)

requests
| where operation_Name contains "xxxxxxx" and cloud_RoleName == "xxxxxxxxxxxxxxx"
| summarize avgRequestDuration=avg(duration), percentiles(duration, 95, 99) by bin(timestamp, 1m)
| extend SLA = 1000
| project SLA, avgRequestDuration, percentile_duration_95, percentile_duration_99, timestamp
| render timechart with (ytitle="Duration in MS")

Can someone please help?

Azure Monitor
Azure Monitor
An Azure service that is used to collect, analyze, and act on telemetry data from Azure and on-premises environments.
2,909 questions
{count} votes

2 answers

Sort by: Most helpful
  1. SwathiDhanwada-MSFT 18,041 Reputation points
    2020-06-05T10:36:03.267+00:00

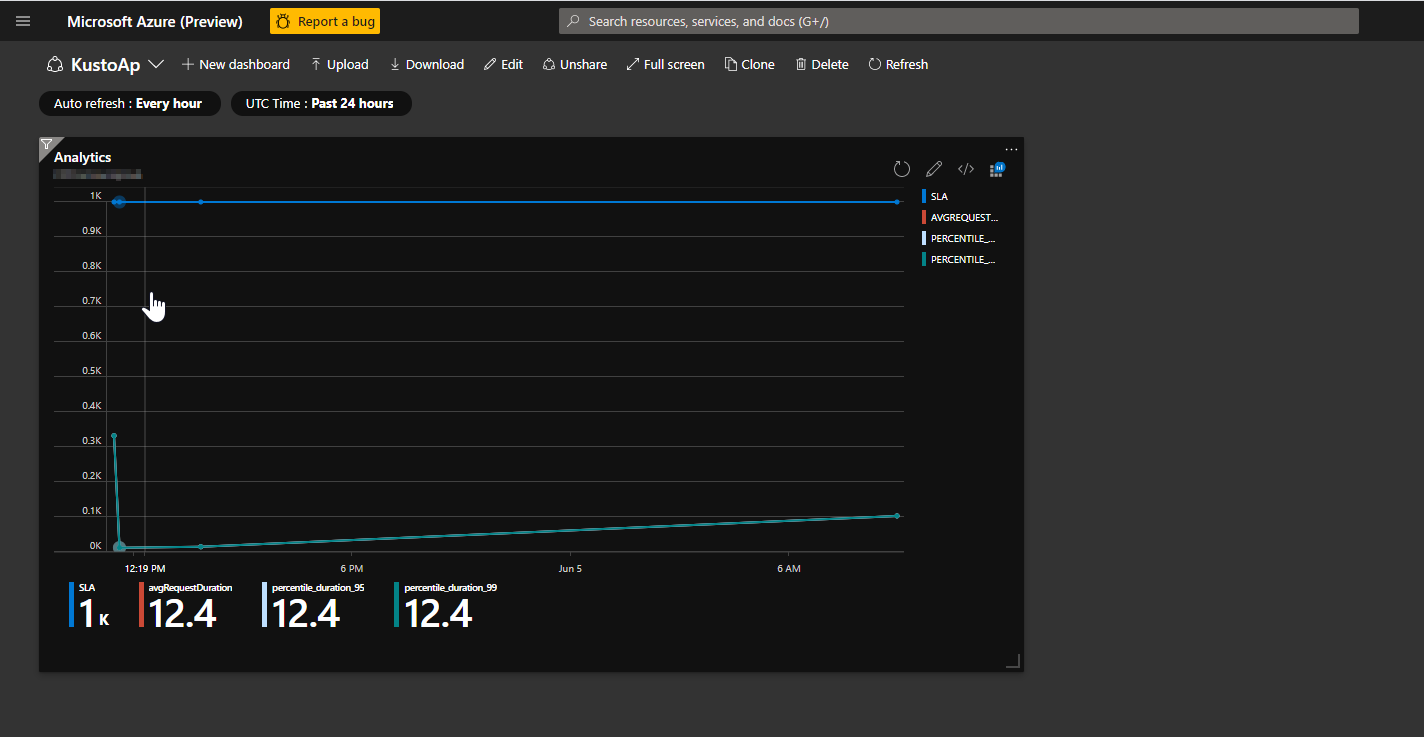
    @TTLAzure Thanks for your question !! I have reproduced your issue by adding reference line to identify if the metric exceeded a specific threshold and I am able to view the threshold line. Snapshot for your reference. Kindly check again from your end and revert if you have further questions.
    9231-2020-06-05-16-03-51-kustoap-microsoft-azure.png

    0 comments No comments

  2. TTLAzure 1 Reputation point
    2020-06-07T19:53:36.203+00:00

    @SwathiDhanwada-MSFT

    My question is about "Duration in MS" in Ytitle column, If you see 0k, 0.1k,.....0.8k,0.9k,1k , what is this about ? if we didnt specify that these are in Milliseconds no one knows its time in MS.

    We know Response time will be in MilliSeconds , But i wanted to display the title there saying its Duration in MS. So it will be easy for everyone to understand who see my chart.

    9274-capture1.png

    Please check and suggest