Monitor the health of log search alert rules
Azure Service Health monitors the health of your cloud resources, including log search alert rules. When a log search alert rule is healthy, the rule runs and the query executes successfully. This article explains how to view the health status of your log search alert rule, and tells you what to do if there are issues affecting your log search alert rules.
Azure Service Health monitors:
- Resource health: information about the health of your individual cloud resources, such as a specific log search alert rule.
- Service health: information about the health of the Azure services and regions you're using, which might affect your log search alert rule, including communications about outages, planned maintenance activities, and other health advisories.
Note
Today, the report health status is supported only for rules with a frequency of 15 minutes or lower. For rules that run at a frequency greater than 15 minutes (such as 30 minutes, 1 hour, etc.), the status in the resource health blade will be ‘Unavailable’.
Permissions required
- To view the health of a log search alert rule, you need
readpermissions to the log search alert rule. - To set up health status alerts, you need
writepermissions to the log search alert rule, as provided by the Monitoring Contributor built-in role, for example.
View health and set up health status alerts for log search alert rules
To view the health of your log search alert rule and set up health status alerts:
In the portal, select Monitor, then Alerts.
From the top command bar, select Alert rules. The page shows all your alert rules on all subscriptions.
Select the log search alert rule that you want to monitor.
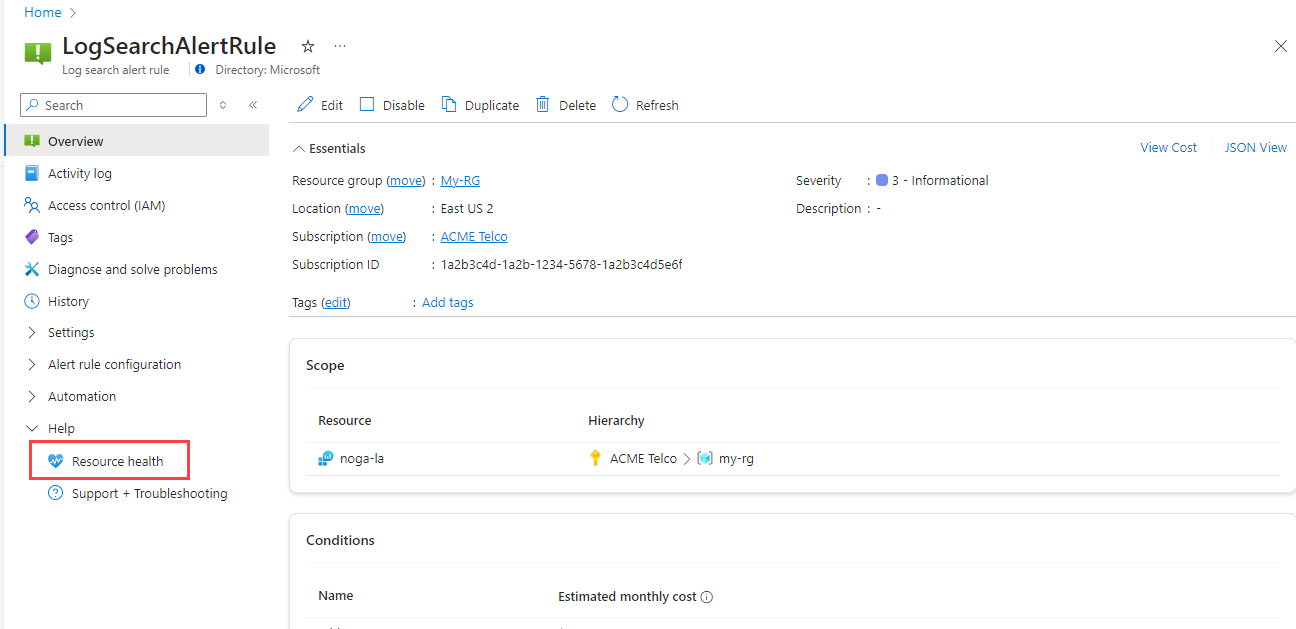
From the left pane, under Help, select Resource health.
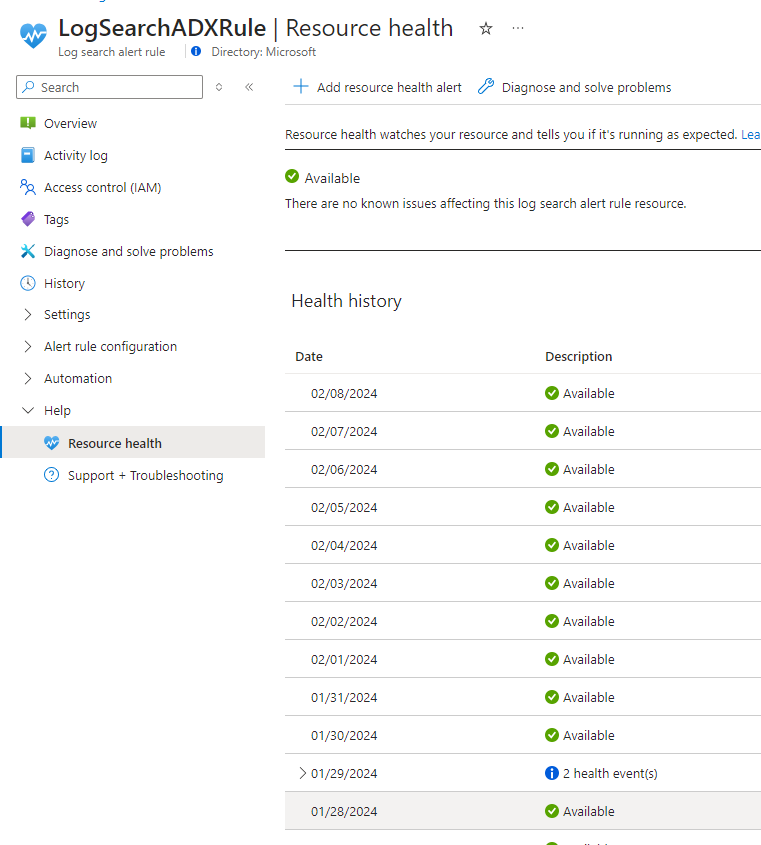
The Resource health screen shows:
Health history: Indicates whether Azure Service Health detected query execution issues in the specific log search alert rule. Select the health event to view details about the event.
Azure service issues: Displayed when a known issue with an Azure service might affect execution of the log search alert query. Select the message to view details about the service issue in Azure Service Health.
Note
- Service health notifications do not indicate that your log search alert rule is necessarily affected by the known service issue. If your log search alert rule health status is Available, Azure Service Health did not detect issues in your alert rule.
This table describes the possible resource health status values for a log search alert rule:
| Resource health status | Description | Recommended steps |
|---|---|---|
| Available | There are no known issues affecting this log search alert rule. | |
| Unknown | This log search alert rule is currently disabled or in an unknown state. | Check if this log alert rule has been disabled. See Log alert was disabled for more information. |
| Unavailable | If your rule runs less frequently than every 15 minutes (for example, if it is set to run every 30 minutes or 1 hour), it won’t provide health status updates. An ‘unavailable’ status is to be expected and is not indicative of an issue. | To get the health status of an alert rule, set the frequency of the alert rule to 15 min or less. |
| Unknown reason | This log search alert rule is currently unavailable due to an unknown reason. | Check if the alert rule was recently created. Health status is updated after the rule completes its first evaluation. |
| Degraded due to unknown reason | This log search alert rule is currently degraded due to an unknown reason. | |
| Setting up resource health | Setting up Resource health for this resource. | Check if the alert rule was recently created. Health status is updated after the rule completes its first evaluation. |
| Semantic error | The query is failing because of a semantic error. | Review the query and try again. |
| Syntax error | The query is failing because of a syntax error. | Review the query and try again. |
| The response size is too large | The query is failing because its response size is too large. | Review your query and the log queries limits. |
| Query consuming too many resources | The query is failing because it's consuming too many resources. | Review your query. View our best practices for optimizing log queries. |
| Query validation error | The query is failing because of a validation error. | Check if the table referenced in your query is set to Compare the Basic and Analytics log data plans, which doesn't support alerts. |
| Workspace not found | The target Log Analytics workspace for this alert rule couldn't be found. | The target specified in the scope of the alert rule was moved, renamed, or deleted. Recreate your alert rule with a valid Log Analytics workspace target. |
| Application Insights resource not found | The target Application Insights resource for this alert rule couldn't be found. | The target specified in the scope of the alert rule was moved, renamed, or deleted. Recreate your alert rule with a valid Log Analytics workspace target. |
| Query is throttled | The query is failing for the rule because of throttling (Error 429). | Review your query and the log queries limits. |
| Unauthorized to run query | The query is failing because the query doesn't have the correct permissions. | Permissions are based on the permissions of the last user that edited the rule. If you suspect that the query doesn't have access, any user with the required permissions can edit or update the rule. Once the rule is saved, the new permissions take effect. If you're using managed identities, check that the identity has permissions on the target resource. See managed identities. |
| NSP validation failed | The query is failing because of NSP validations issues. | Review your network security perimeter rules to ensure your alert rule is correctly configured. |
| Active alerts limit exceeded | Alert evaluation failed due to exceeding the limit of fired (non- resolved) alerts per day. | See Azure Monitor service limits. |
| Dimension combinations limit exceeded | Alert evaluation failed due to exceeding the allowed limit of dimension combinations values meeting the threshold. | See Azure Monitor service limits. |
| Unavailable for unknown reason | Today, the report health status is supported only for rules with a frequency of 15 minutes or lower. | For using Resource Health the fequency should be 5 minutes or lower. |
Add a new resource health alert
Select Add resource health alert.
The Create alert rule wizard opens, with the Scope and Condition panes prepopulated. If necessary, you can edit and modify the scope and condition of the alert rule at this stage.
Follow the rest of the steps in Create or edit an activity log, service health, or resource health alert rule.
Next steps
Learn more about:
Feedback
Coming soon: Throughout 2024 we will be phasing out GitHub Issues as the feedback mechanism for content and replacing it with a new feedback system. For more information see: https://aka.ms/ContentUserFeedback.
Submit and view feedback for