Configuring JMX metrics
Application Insights Java 3.x collects some of the Java Management Extensions (JMX) metrics by default, but in many cases it isn't enough. This document describes the JMX configuration option in details.
How do I collect extra JMX metrics?
JMX metrics collection can be configured by adding a "jmxMetrics" section to the applicationinsights.json file. Enter a name for the metric as you want it to appear in Azure portal in application insights resource. Object name and attribute are required for each of the metrics you want collected.
How do I know what metrics are available to configure?
You nailed it - you must know the object names and the attributes, those properties are different for various libraries, frameworks, and application servers, and are often not well documented. Luckily, it's easy to find exactly what JMX metrics are supported for your particular environment.
To view the available metrics, set the self-diagnostics level to DEBUG in your applicationinsights.json configuration file, for example:
{
  "selfDiagnostics": {
    "level": "DEBUG"
  }
}
Available JMX metrics, with object names and attribute names, appear in your Application Insights log file.
Log file output looks similar to these examples. In some cases, it can be extensive.
You can also use a command line tool to check the available JMX metrics.
Configuration example
Knowing what metrics are available, you can configure the agent to collect them. The first one is an example of a nested metric - LastGcInfo that has several properties, and we want to capture the GcThreadCount.
"jmxMetrics": [
      {
        "name": "Demo - GC Thread Count",
        "objectName": "java.lang:type=GarbageCollector,name=PS MarkSweep",
        "attribute": "LastGcInfo.GcThreadCount"
      },
      {
        "name": "Demo - GC Collection Count",
        "objectName": "java.lang:type=GarbageCollector,name=PS MarkSweep",
        "attribute": "CollectionCount"
      },
      {
        "name": "Demo - Thread Count",
        "objectName": "java.lang:type=Threading",
        "attribute": "ThreadCount"
      }
],
Where do I find the JMX Metrics in application insights?
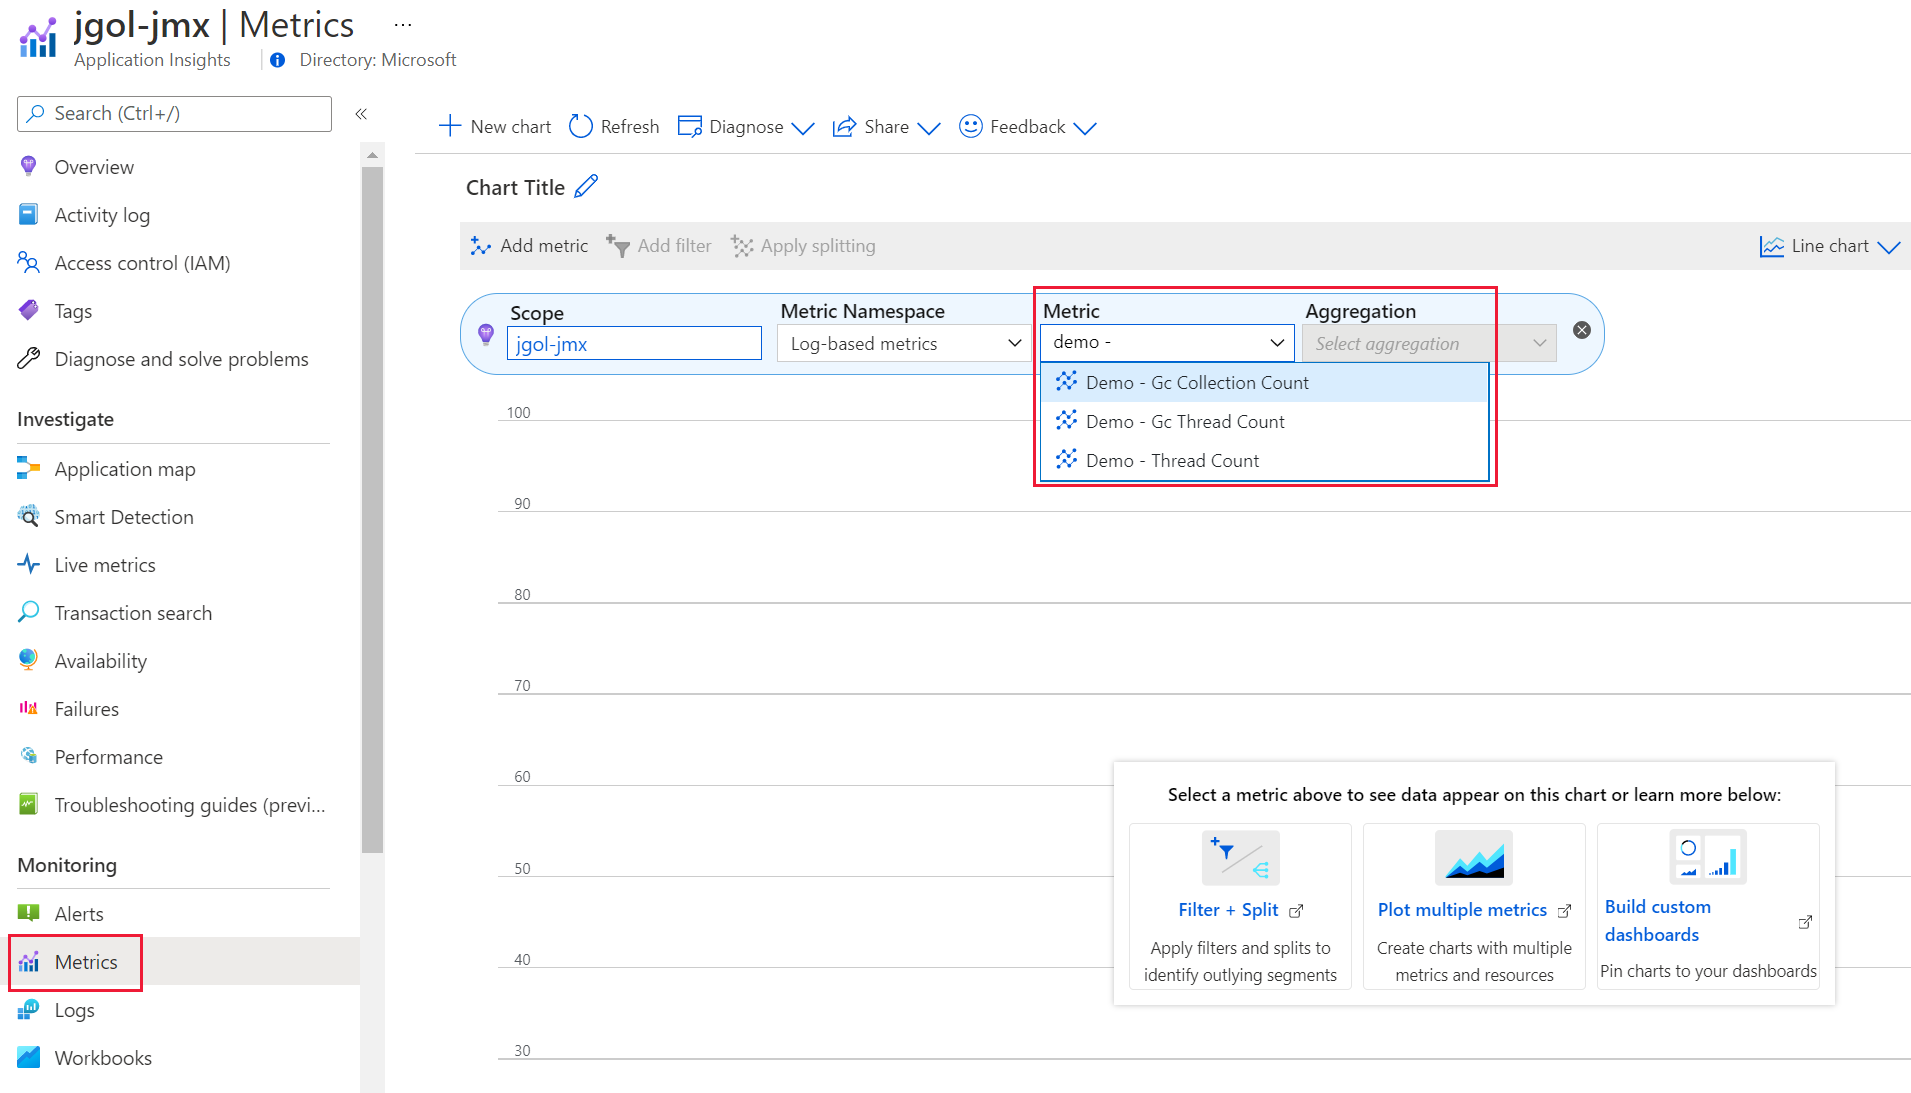
You can view the JMX metrics collected while your application is running by navigating to your application insights resource in the Azure portal. Under Metrics tab, select the dropdown as shown to view the metrics.
Feedback
Coming soon: Throughout 2024 we will be phasing out GitHub Issues as the feedback mechanism for content and replacing it with a new feedback system. For more information see: https://aka.ms/ContentUserFeedback.
Submit and view feedback for

