Understand data view mapping in Power BI visuals
This article discusses data view mapping and describes how data roles are used to create different types of visuals. It explains how to specify conditional requirements for data roles and the different dataMappings types.
Each valid mapping produces a data view. You can provide multiple data mappings under certain conditions. The supported mapping options are:
"dataViewMappings": [
    {
        "conditions": [ ... ],
        "categorical": { ... },
        "single": { ... },
        "table": { ... },
        "matrix": { ... }
    }
]
Power BI creates a mapping to a data view only if the valid mapping is also defined in dataViewMappings.
In other words, categorical might be defined in dataViewMappings but other mappings, such as table or single, might not be. In that case, Power BI produces a data view with a single categorical mapping, while table and other mappings remain undefined. For example:
"dataViewMappings": [
    {
    "categorical": {
        "categories": [ ... ],
        "values": [ ... ]
    },
    "metadata": { ... }
    }
]
Conditions
The conditions section establishes rules for a particular data mapping. If the data matches one of the described sets of conditions, the visual accepts the data as valid.
For each field, you can specify a minimum and maximum value. The value represents the number of fields that can be bound to that data role.
Note
If a data role is omitted in the condition, it can have any number of fields.
In the following example, the category is limited to one data field and the measure is limited to two data fields.
"conditions": [
    { "category": { "max": 1 }, "measure": { "max": 2 } },
]
You can also set multiple conditions for a data role. In that case, the data is valid if any one of the conditions is met.
"conditions": [
    { "category": { "min": 1, "max": 1 }, "measure": { "min": 2, "max": 2 } },
    { "category": { "min": 2, "max": 2 }, "measure": { "min": 1, "max": 1 } }
]
In the previous example, one of the following two conditions is required:
- Exactly one category field and exactly two measures
- Exactly two categories and exactly one measure
Single data mapping
Single data mapping is the simplest form of data mapping. It accepts a single measure field and returns the total. If the field is numeric, it returns the sum. Otherwise, it returns a count of unique values.
To use single data mapping, define the name of the data role that you want to map. This mapping works only with a single measure field. If a second field is assigned, no data view is generated, so it's good practice to include a condition that limits the data to a single field.
Note
This data mapping can't be used in conjunction with any other data mapping. It's meant to reduce data to a single numeric value.
For example:
{
    "dataRoles": [
        {
            "displayName": "Y",
            "name": "Y",
            "kind": "Measure"
        }
    ],
    "dataViewMappings": [
        {
            "conditions": [
                {
                    "Y": {
                        "max": 1
                    }
                }
            ],
            "single": {
                "role": "Y"
            }
        }
    ]
}
The resulting data view can still contain other types of mapping, like table or categorical, but each mapping contains only the single value. The best practice is to access the value only in single mapping.
{
    "dataView": [
        {
            "metadata": null,
            "categorical": null,
            "matrix": null,
            "table": null,
            "tree": null,
            "single": {
                "value": 94163140.3560001
            }
        }
    ]
}
The following code sample processes simple data views mapping:
"use strict";
import powerbi from "powerbi-visuals-api";
import DataView = powerbi.DataView;
import DataViewSingle = powerbi.DataViewSingle;
// standard imports
// ...

export class Visual implements IVisual {
    private target: HTMLElement;
    private host: IVisualHost;
    private valueText: HTMLParagraphElement;

    constructor(options: VisualConstructorOptions) {
        // constructor body
        this.target = options.element;
        this.host = options.host;
        this.valueText = document.createElement("p");
        this.target.appendChild(this.valueText);
        // ...
    }

    public update(options: VisualUpdateOptions) {
        const dataView: DataView = options.dataViews[0];
        const singleDataView: DataViewSingle = dataView.single;

        if (!singleDataView ||
            !singleDataView.value ) {
            return
        }

        this.valueText.innerText = singleDataView.value.toString();
    }
}
The previous code sample results in the display of a single value from Power BI:
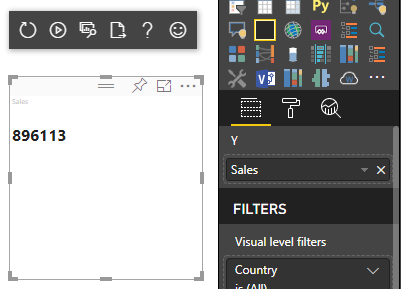
Categorical data mapping
Categorical data mapping is used to get independent groupings or categories of data. The categories can also be grouped together by using "group by" in the data mapping.
Basic categorical data mapping
Consider the following data roles and mappings:
"dataRoles":[
    {
        "displayName": "Category",
        "name": "category",
        "kind": "Grouping"
    },
    {
        "displayName": "Y Axis",
        "name": "measure",
        "kind": "Measure"
    }
],
"dataViewMappings": {
    "categorical": {
        "categories": {
            "for": { "in": "category" }
        },
        "values": {
            "select": [
                { "bind": { "to": "measure" } }
            ]
        }
    }
}
The previous example reads "Map my category data role so that for every field I drag into category, its data is mapped to categorical.categories. Also, map my measure data role to categorical.values."
- for...in: Includes all items in this data role in the data query.
- bind...to: Produces the same result as for...in but expects the data role to have a condition restricting it to a single field.
Group categorical data
The next example uses the same two data roles as the previous example and adds two more data roles named grouping and measure2.
"dataRole":[
    {
        "displayName": "Category",
        "name": "category",
        "kind": "Grouping"
    },
    {
        "displayName": "Y Axis",
        "name": "measure",
        "kind": "Measure"
    },
    {
        "displayName": "Grouping with",
        "name": "grouping",
        "kind": "Grouping"
    },
    {
        "displayName": "X Axis",
        "name": "measure2",
        "kind": "Grouping"
    }
],
"dataViewMappings":{
    "categorical": {
        "categories": {
            "for": { "in": "category" }
        },
        "values": {
            "group": {
                "by": "grouping",
                "select":[
                    { "bind": { "to": "measure" } },
                    { "bind": { "to": "measure2" } }
                ]
            }
        }
    }
}
The difference between this mapping and the basic mapping is how categorical.values is mapped. When you map the measure and measure2 data roles to the data role grouping, the x-axis and y-axis can be scaled appropriately.
Group hierarchical data
In the next example, the categorical data is used to create a hierarchy, which can be used to support drill-down actions.
The following example shows the data roles and mappings:
"dataRoles": [
    {
        "displayName": "Categories",
        "name": "category",
        "kind": "Grouping"
    },
    {
        "displayName": "Measures",
        "name": "measure",
        "kind": "Measure"
    },
    {
        "displayName": "Series",
        "name": "series",
        "kind": "Measure"
    }
],
"dataViewMappings": [
    {
        "categorical": {
            "categories": {
                "for": {
                    "in": "category"
                }
            },
            "values": {
                "group": {
                    "by": "series",
                    "select": [{
                            "for": {
                                "in": "measure"
                            }
                        }
                    ]
                }
            }
        }
    }
]
Consider the following categorical data:
| Country/Region | 2013 | 2014 | 2015 | 2016 |
|---|---|---|---|---|
| USA | x | x | 650 | 350 |
| Canada | x | 630 | 490 | x |
| Mexico | 645 | x | x | x |
| UK | x | x | 831 | x |
Power BI produces a categorical data view with the following set of categories.
{
    "categorical": {
        "categories": [
            {
                "source": {...},
                "values": [
                    "Canada",
                    "USA",
                    "UK",
                    "Mexico"
                ],
                "identity": [...],
                "identityFields": [...],
            }
        ]
    }
}
Each category maps to a set of values. Each of these values is grouped by series, which is expressed as years.
For example, each values array represents one year.
Also, each values array has four values: Canada, USA, UK, and Mexico.
{
    "values": [
        // Values for year 2013
        {
            "source": {...},
            "values": [
                null, // Value for `Canada` category
                null, // Value for `USA` category
                null, // Value for `UK` category
                645 // Value for `Mexico` category
            ],
            "identity": [...],
        },
        // Values for year 2014
        {
            "source": {...},
            "values": [
                630, // Value for `Canada` category
                null, // Value for `USA` category
                null, // Value for `UK` category
                null // Value for `Mexico` category
            ],
            "identity": [...],
        },
        // Values for year 2015
        {
            "source": {...},
            "values": [
                490, // Value for `Canada` category
                650, // Value for `USA` category
                831, // Value for `UK` category
                null // Value for `Mexico` category
            ],
            "identity": [...],
        },
        // Values for year 2016
        {
            "source": {...},
            "values": [
                null, // Value for `Canada` category
                350, // Value for `USA` category
                null, // Value for `UK` category
                null // Value for `Mexico` category
            ],
            "identity": [...],
        }
    ]
}
The following code sample is for processing categorical data view mapping. This sample creates the hierarchical structure Country/Region > Year > Value.
"use strict";
import powerbi from "powerbi-visuals-api";
import DataView = powerbi.DataView;
import DataViewCategorical = powerbi.DataViewCategorical;
import DataViewValueColumnGroup = powerbi.DataViewValueColumnGroup;
import PrimitiveValue = powerbi.PrimitiveValue;
// standard imports
// ...

export class Visual implements IVisual {
    private target: HTMLElement;
    private host: IVisualHost;
    private categories: HTMLElement;

    constructor(options: VisualConstructorOptions) {
        // constructor body
        this.target = options.element;
        this.host = options.host;
        this.categories = document.createElement("pre");
        this.target.appendChild(this.categories);
        // ...
    }

    public update(options: VisualUpdateOptions) {
        const dataView: DataView = options.dataViews[0];
        const categoricalDataView: DataViewCategorical = dataView.categorical;

        if (!categoricalDataView ||
            !categoricalDataView.categories ||
            !categoricalDataView.categories[0] ||
            !categoricalDataView.values) {
            return;
        }

        // Categories have only one column in data buckets
        // To support several columns of categories data bucket, iterate categoricalDataView.categories array.
        const categoryFieldIndex = 0;
        // Measure has only one column in data buckets.
        // To support several columns on data bucket, iterate years.values array in map function
        const measureFieldIndex = 0;
        let categories: PrimitiveValue[] = categoricalDataView.categories[categoryFieldIndex].values;
        let values: DataViewValueColumnGroup[] = categoricalDataView.values.grouped();

        let data = {};
        // iterate categories/countries-regions
        categories.map((category: PrimitiveValue, categoryIndex: number) => {
            data[category.toString()] = {};
            // iterate series/years
            values.map((years: DataViewValueColumnGroup) => {
                if (!data[category.toString()][years.name] && years.values[measureFieldIndex].values[categoryIndex]) {
                    data[category.toString()][years.name] = []
                }
                if (years.values[0].values[categoryIndex]) {
                    data[category.toString()][years.name].push(years.values[measureFieldIndex].values[categoryIndex]);
                }
            });
        });

        this.categories.innerText = JSON.stringify(data, null, 6);
        console.log(data);
    }
}
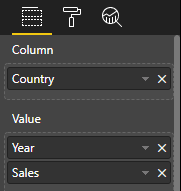
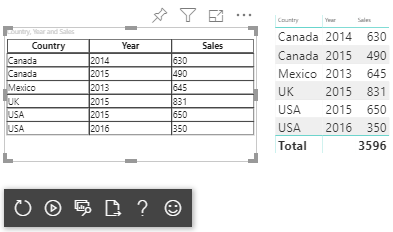
Here's the resulting visual:

Mapping tables
The table data view is essentially a list of data points where numeric data points can be aggregated.
For example, use the same data in the previous section, but with the following capabilities:
"dataRoles": [
    {
        "displayName": "Column",
        "name": "column",
        "kind": "Grouping"
    },
    {
        "displayName": "Value",
        "name": "value",
        "kind": "Measure"
    }
],
"dataViewMappings": [
    {
        "table": {
            "rows": {
                "select": [
                    {
                        "for": {
                            "in": "column"
                        }
                    },
                    {
                        "for": {
                            "in": "value"
                        }
                    }
                ]
            }
        }
    }
]
Visualize the table data view like this example:
| Country/Region | Year | Sales |
|---|---|---|
| USA | 2016 | 100 |
| USA | 2015 | 50 |
| Canada | 2015 | 200 |
| Canada | 2015 | 50 |
| Mexico | 2013 | 300 |
| UK | 2014 | 150 |
| USA | 2015 | 75 |
Data binding:
Power BI displays your data as the table data view. Don't assume that the data is ordered.
{
    "table" : {
        "columns": [...],
        "rows": [
            [
                "Canada",
                2014,
                630
            ],
            [
                "Canada",
                2015,
                490
            ],
            [
                "Mexico",
                2013,
                645
            ],
            [
                "UK",
                2014,
                831
            ],
            [
                "USA",
                2015,
                650
            ],
            [
                "USA",
                2016,
                350
            ]
        ]
    }
}
To aggregate the data, select the desired field and then choose Sum.

Code sample to process table data view mapping.
"use strict";
import "./../style/visual.less";
import powerbi from "powerbi-visuals-api";
// ...
import DataViewMetadataColumn = powerbi.DataViewMetadataColumn;
import DataViewTable = powerbi.DataViewTable;
import DataViewTableRow = powerbi.DataViewTableRow;
import PrimitiveValue = powerbi.PrimitiveValue;
// standard imports
// ...

export class Visual implements IVisual {
    private target: HTMLElement;
    private host: IVisualHost;
    private table: HTMLParagraphElement;

    constructor(options: VisualConstructorOptions) {
        // constructor body
        this.target = options.element;
        this.host = options.host;
        this.table = document.createElement("table");
        this.target.appendChild(this.table);
        // ...
    }

    public update(options: VisualUpdateOptions) {
        const dataView: DataView = options.dataViews[0];
        const tableDataView: DataViewTable = dataView.table;

        if (!tableDataView) {
            return
        }
        while(this.table.firstChild) {
            this.table.removeChild(this.table.firstChild);
        }

        //draw header
        const tableHeader = document.createElement("th");
        tableDataView.columns.forEach((column: DataViewMetadataColumn) => {
            const tableHeaderColumn = document.createElement("td");
            tableHeaderColumn.innerText = column.displayName
            tableHeader.appendChild(tableHeaderColumn);
        });
        this.table.appendChild(tableHeader);

        //draw rows
        tableDataView.rows.forEach((row: DataViewTableRow) => {
            const tableRow = document.createElement("tr");
            row.forEach((columnValue: PrimitiveValue) => {
                const cell = document.createElement("td");
                cell.innerText = columnValue.toString();
                tableRow.appendChild(cell);
            })
            this.table.appendChild(tableRow);
        });
    }
}
The visual styles file style/visual.less contains the layout for the table:
table {
    display: flex;
    flex-direction: column;
}

tr, th {
    display: flex;
    flex: 1;
}

td {
    flex: 1;
    border: 1px solid black;
}
The resulting visual looks like this:
Matrix data mapping
Matrix data mapping is similar to table data mapping, but the rows are presented hierarchically. Any of the data role values can be used as a column header value.
{
    "dataRoles": [
        {
            "name": "Category",
            "displayName": "Category",
            "displayNameKey": "Visual_Category",
            "kind": "Grouping"
        },
        {
            "name": "Column",
            "displayName": "Column",
            "displayNameKey": "Visual_Column",
            "kind": "Grouping"
        },
        {
            "name": "Measure",
            "displayName": "Measure",
            "displayNameKey": "Visual_Values",
            "kind": "Measure"
        }
    ],
    "dataViewMappings": [
        {
            "matrix": {
                "rows": {
                    "for": {
                        "in": "Category"
                    }
                },
                "columns": {
                    "for": {
                        "in": "Column"
                    }
                },
                "values": {
                    "select": [
                        {
                            "for": {
                                "in": "Measure"
                            }
                        }
                    ]
                }
            }
        }
    ]
}
Hierarchical structure of matrix data
Power BI creates a hierarchical data structure. The root of the tree hierarchy includes the data from the Parents column of the Category data role with children from the Children column of the data role table.
Semantic model:
| Parents | Children | Grandchildren | Columns | Values |
|---|---|---|---|---|
| Parent1 | Child1 | Grand child1 | Col1 | 5 |
| Parent1 | Child1 | Grand child1 | Col2 | 6 |
| Parent1 | Child1 | Grand child2 | Col1 | 7 |
| Parent1 | Child1 | Grand child2 | Col2 | 8 |
| Parent1 | Child2 | Grand child3 | Col1 | 5 |
| Parent1 | Child2 | Grand child3 | Col2 | 3 |
| Parent1 | Child2 | Grand child4 | Col1 | 4 |
| Parent1 | Child2 | Grand child4 | Col2 | 9 |
| Parent1 | Child2 | Grand child5 | Col1 | 3 |
| Parent1 | Child2 | Grand child5 | Col2 | 5 |
| Parent2 | Child3 | Grand child6 | Col1 | 1 |
| Parent2 | Child3 | Grand child6 | Col2 | 2 |
| Parent2 | Child3 | Grand child7 | Col1 | 7 |
| Parent2 | Child3 | Grand child7 | Col2 | 1 |
| Parent2 | Child3 | Grand child8 | Col1 | 10 |
| Parent2 | Child3 | Grand child8 | Col2 | 13 |
The core matrix visual of Power BI renders the data as a table.

The visual gets its data structure as described in the following code (only the first two table rows are shown here):
{
    "metadata": {...},
    "matrix": {
        "rows": {
            "levels": [...],
            "root": {
                "childIdentityFields": [...],
                "children": [
                    {
                        "level": 0,
                        "levelValues": [...],
                        "value": "Parent1",
                        "identity": {...},
                        "childIdentityFields": [...],
                        "children": [
                            {
                                "level": 1,
                                "levelValues": [...],
                                "value": "Child1",
                                "identity": {...},
                                "childIdentityFields": [...],
                                "children": [
                                    {
                                        "level": 2,
                                        "levelValues": [...],
                                        "value": "Grand child1",
                                        "identity": {...},
                                        "values": {
                                            "0": {
                                                "value": 5 // value for Col1
                                            },
                                            "1": {
                                                "value": 6 // value for Col2
                                            }
                                        }
                                    },
                                    ...
                                ]
                            },
                            ...
                        ]
                    },
                    ...
                ]
            }
        },
        "columns": {
            "levels": [...],
            "root": {
                "childIdentityFields": [...],
                "children": [
                    {
                        "level": 0,
                        "levelValues": [...],
                        "value": "Col1",
                        "identity": {...}
                    },
                    {
                        "level": 0,
                        "levelValues": [...],
                        "value": "Col2",
                        "identity": {...}
                    },
                    ...
                ]
            }
        },
        "valueSources": [...]
    }
}
Expand and collapse row headers
For API 4.1.0 or later, matrix data supports expanding and collapsing row headers. From API 4.2 you can expand/collapse entire level programmatically. The expand and collapse feature optimizes fetching data to the dataView by allowing the user to expand or collapse a row without fetching all the data for the next level. It only fetches the data for the selected row. The row header’s expansion state remains consistent across bookmarks and even across saved reports. It's not specific to each visual.
Expand and collapse commands can be added to the context menu by supplying the dataRoles parameter to the showContextMenu method.
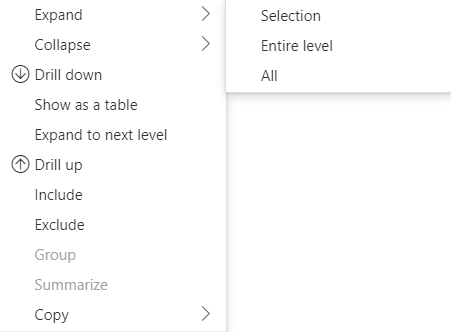
To expand a large number of data points, use the fetch more data API with the expand/collapse API.
API features
The following elements have been added to API version 4.1.0 to enable expanding and collapsing row headers:
The
isCollapsedflag in theDataViewTreeNode:interface DataViewTreeNode { //... /** * TRUE if the node is Collapsed * FALSE if it is Expanded * Undefined if it cannot be Expanded (e.g. subtotal) */ isCollapsed?: boolean; }The
toggleExpandCollapsemethod in theISelectionMangerinterface:interface ISelectionManager { //... showContextMenu(selectionId: ISelectionId, position: IPoint, dataRoles?: string): IPromise<{}>; // dataRoles is the name of the role of the selected data point toggleExpandCollapse(selectionId: ISelectionId, entireLevel?: boolean): IPromise<{}>; // Expand/Collapse an entire level will be available from API 4.2.0 //... }The
canBeExpandedflag in the DataViewHierarchyLevel:interface DataViewHierarchyLevel { //... /** If TRUE, this level can be expanded/collapsed */ canBeExpanded?: boolean; }
Visual requirements
To enable the expand collapse feature on a visual by using the matrix data view:
Add the following code to the capabilities.json file:
   "expandCollapse": {
    "roles": ["Rows"], //”Rows” is the name of rows data role
    "addDataViewFlags": {
        "defaultValue": true //indicates if the DataViewTreeNode will get the isCollapsed flag by default
    }
},
Confirm that the roles are drillable:
    "drilldown": {
    "roles": ["Rows"]
},
For each node, create an instance of the selection builder by calling the
withMatrixNodemethod in the selected node hierarchy level and creating aselectionId. For example:let nodeSelectionBuilder: ISelectionIdBuilder = visualHost.createSelectionIdBuilder(); // parantNodes is a list of the parents of the selected node. // node is the current node which the selectionId is created for. parentNodes.push(node); for (let i = 0; i < parentNodes.length; i++) { nodeSelectionBuilder = nodeSelectionBuilder.withMatrixNode(parentNodes[i], levels); } const nodeSelectionId: ISelectionId = nodeSelectionBuilder.createSelectionId();Create an instance of the selection manager, and use the
selectionManager.toggleExpandCollapse()method, with the parameter of theselectionId, that you created for the selected node. For example:// handle click events to apply expand\collapse action for the selected node button.addEventListener("click", () => { this.selectionManager.toggleExpandCollapse(nodeSelectionId); });
Note
- If the selected node is not a row node, PowerBI will ignore expand and collapse calls and the expand and collapse commands will be removed from the context menu.
- The
dataRolesparameter is required for theshowContextMenumethod only if the visual supportsdrilldownorexpandCollapsefeatures. If the visual supports these features but the dataRoles wasn't supplied, an error will output to the console when using the developer visual or if debugging a public visual with debug mode enabled.
Considerations and limitations
- After you expand a node, new data limits will be applied to the DataView. The new DataView might not include some of the nodes presented in the previous DataView.
- When using expand or collapse, totals are added even if the visual didn’t request them.
- Expanding and collapsing columns isn't supported.
Keep all metadata columns
For API 5.1.0 or later, keeping all metadata columns is supported. This feature allows the visual to receive the metadata for all columns no matter what their active projections are.
Add the following lines to your capabilities.json file:
"keepAllMetadataColumns": {
    "type": "boolean",
    "description": "Indicates that visual is going to receive all metadata columns, no matter what the active projections are"
}
Setting this property to true will result in receiving all the metadata, including from collapsed columns. Setting it to false or leaving it undefined will result in receiving metadata only on columns with active projections (expanded, for example).
Data reduction algorithm
The data reduction algorithm controls which data and how much data is received in the data view.
The count is set to the maximum number of values that the data view can accept. If there are more than count values, the data reduction algorithm determines which values should be received.
Data reduction algorithm types
There are four types of data reduction algorithm settings:
top: The first count values are taken from the semantic model.bottom: The last count values are taken from the semantic model.sample: The first and last items are included, and count number of items with equal intervals between them. For example, if you have a semantic model [0, 1, 2, ... 100] and a count of 9, you receive the values [0, 10, 20 ... 100].window: Loads one window of data points at a time containing count elements. Currently,topandwindoware equivalent. In the future, a windowing setting will be fully supported.
By default, all Power BI visuals have the top data reduction algorithm applied with the count set to 1000 data points. This default is equivalent to setting the following properties in the capabilities.json file:
"dataReductionAlgorithm": {
    "top": {
        "count": 1000
    }
}
You can modify the count value to any integer value up to 30000. R-based Power BI visuals can support up to 150000 rows.
Data reduction algorithm usage
The data reduction algorithm can be used in categorical, table, or matrix data view mapping.
In categorical data mapping, you can add the algorithm to the "categories" and/or "group" section of values for categorical data mapping.
"dataViewMappings": {
    "categorical": {
        "categories": {
            "for": { "in": "category" },
            "dataReductionAlgorithm": {
                "window": {
                    "count": 300
                }
            }
        },
        "values": {
            "group": {
                "by": "series",
                "select": [{
                        "for": {
                            "in": "measure"
                        }
                    }
                ],
                "dataReductionAlgorithm": {
                    "top": {
                        "count": 100
                    }
                }
            }
        }
    }
}
In table data view mapping, apply the data reduction algorithm to the rows section of the Data View mapping table.
"dataViewMappings": [
    {
        "table": {
            "rows": {
                "for": {
                    "in": "values"
                },
                "dataReductionAlgorithm": {
                    "top": {
                        "count": 2000
                    }
                }
            }
        }
    }
]
You can apply the data reduction algorithm to the rows and columns sections of the Data View mapping matrix.
Related content
Feedback
Coming soon: Throughout 2024 we will be phasing out GitHub Issues as the feedback mechanism for content and replacing it with a new feedback system. For more information see: https://aka.ms/ContentUserFeedback.
Submit and view feedback for