View and understand the home page
When you sign in to conversation intelligence as a sales manager, you'll see the home page. This page provides high-level information on the status of your current sales period and insights into what your customers are talking about, the behaviors of your top sellers, and the team's sales pipeline for the selected time period.
License and role requirements
| Requirement type | You must have |
|---|---|
| License | Dynamics 365 Sales Premium or Dynamics 365 Sales Enterprise More information: Dynamics 365 Sales pricing |
| Security roles | Sales Manager More information: Predefined security roles for Sales |
Sections of the home page
When you sign in to conversation intelligence, the home page appears with the following sections:
Time period filter
You can filter the information on the home page based on a time period, such as the last 24 hours, the last seven days, this month, all time, or a custom time period. For example, to view information for the current month, select This month, and the information will be filtered to display the current month's status in the Base KPIs, What are customers talking about?, What characterizes top sellers?, and Are my team's deals on track? sections.

Note
By default, home page information is displayed starting from the day the application was configured for your organization.
Base KPIs
The base KPIs provide information on the status of your current sales period. By viewing these KPIs, you'll know:
The time left in the current period to achieve your sales target.
The sum of actual revenue of all won opportunities.
The total estimated revenues of all open opportunities.
The total deals that you won in this period.
The percentage of deals that you won against available opportunities in this period.
The average revenue generated through each deal in this period.
The following image is an example of how the base KPIs are displayed.

What are customers talking about?
The What are customers talking about section helps you to understand what's happening in sales calls and what customers are talking about. These insights can provide you with possible ideas for coaching scenarios for your sales team, helping them improve their performance during the sales calls.
This also helps in driving strategic motion by looking at the keywords, brands, and competitors mentioned during the call. For example, "3D printer" is trending more during customer calls, but 3D printer sales aren't reaching targets. You can coach the sales team on how to sell 3D printers more effectively to customers.
The following insights are available for you to understand what customers are talking about:
Customer sentiment
This insight shows the number of calls where the customer sentiments are more negative than average. Using this insight, you can:
- Analyze pain points that customers express during the call, and coach your sellers on how to handle customer conversations well.
- Analyze why customers are expressing these pain points, and identify selling opportunities by addressing the gaps that are causing pain points.
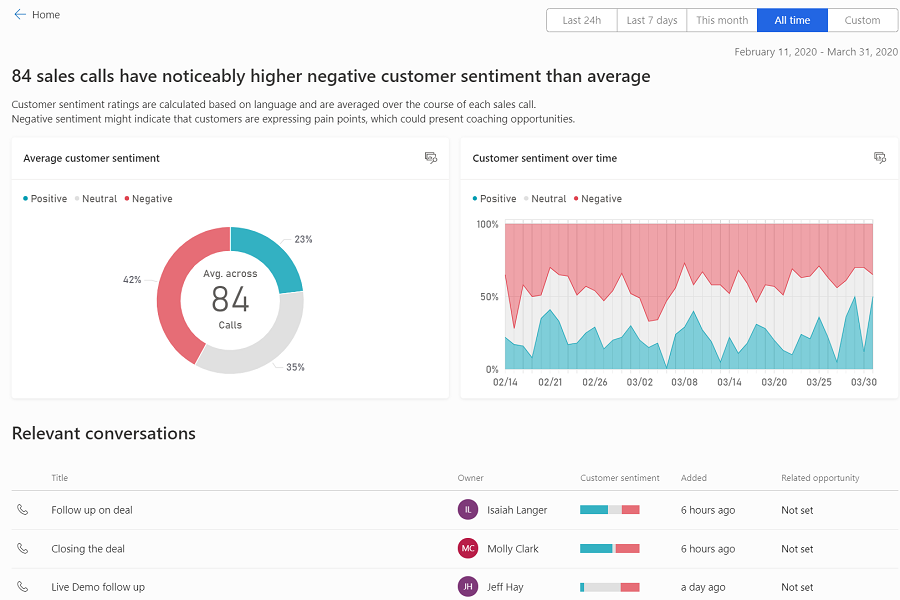
The following image is an example of how the "customer sentiment" insight is displayed.

In this example, you can see that 200 calls have been analyzed and 27 percent of them have higher than the average negative customer sentiment. The doughnut chart shows the percentage of calls that are positive, neutral, and negative.
Select Show details to view more details on how the customer sentiment is trending over time and the list of calls that contributed to this analysis. Furthermore, you can select each call and view the summary. To learn more about call summary, see View and understand call summary.
Tracked keywords
This insight shows the tracked keywords that are defined in the application and that customers use the most during sales calls. Conversation intelligence highlights these tracked keywords in this insight. By using these tracked keywords, you can identify new sales opportunities that are related to them.
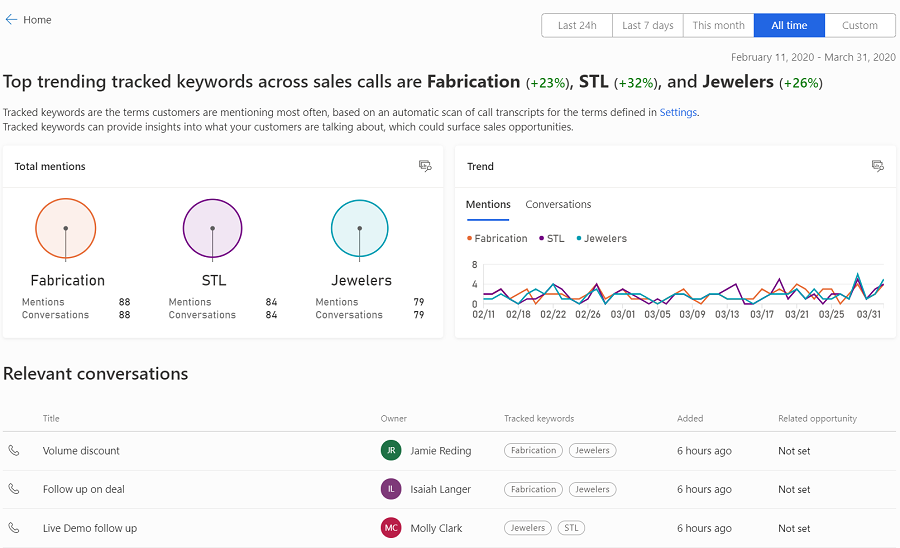
The following image is an example of how the "tracked keywords" insight is displayed.

In this example, you can see that STL (+32 percent), Jewelers (+26 percent), and Fabrication (+23 percent) are the keywords that are trending the highest, so you could theoretically define a sales strategy related to these keywords. The bubbles show the top 20 tracked keywords and the number of times that these keywords were mentioned in calls.
You can define what keywords you want to track during the sales call. To learn more, see Configure keywords and competitors to track.
Select Show details to view more details on top trending keywords. The details include how many times each keyword is mentioned in the total number of calls, the trend of each keyword over time, and the list of calls that are contributing to the keyword analysis. Furthermore, you can select each call and view the summary. To learn more about call summary, see View and understand call summary.
Tracked competitors
This insight shows the defined competitors' names that customers use most and are trending upward during sales calls. Conversation intelligence highlights these competitors in this section. Using these competitors, you can identify new sales opportunities that are related to them.
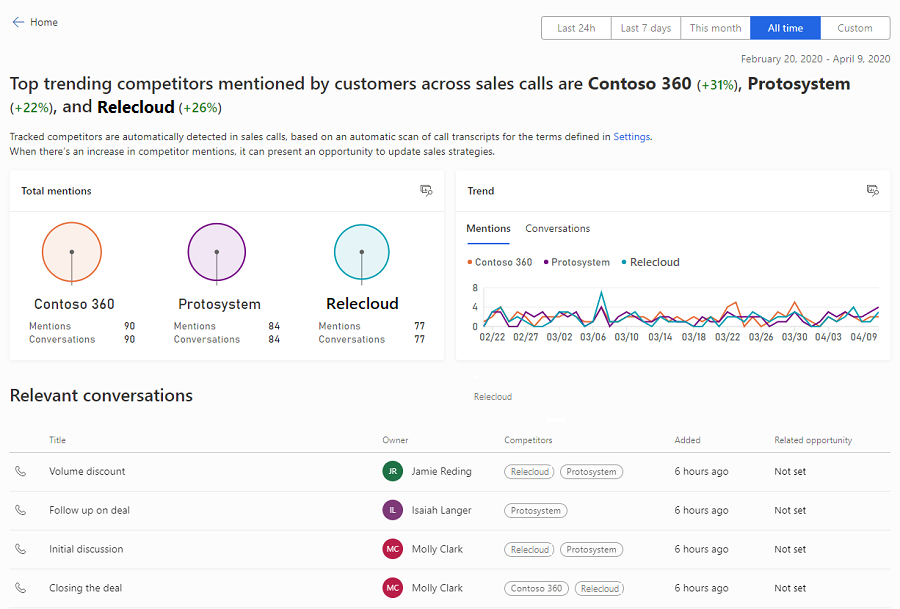
The following image is an example of how the "competitors mentioned" insight is displayed.

In this example, you can see that Contoso 360 (+31 percent), Relecloud (+26 percent), and Protosystem (+22 percent) are the top trending competitors, and you can define a sales strategy related to them. The bubbles show the top 20 competitors and the number of times that these competitors were mentioned in the calls.
You can define which competitors you want to track during the sales call. To learn more, see Configure keywords and competitors to track.
Select Show details to view more details on top trending competitors. The details include how many times each competitor is mentioned in the total number of calls, the trend of each competitor over time, and the list of calls that are contributing in analyzing the competitors. Furthermore, you can select each call and view the summary. To learn more about call summary, see View and understand call summary.
Other brands and organizations
This insight helps to discover new products, brands, and organizations that customers are speaking about in sales calls, which they never spoke of in previous calls. These products, brands, and organizations aren't defined in the application (under tracked keywords and competitors); the application uses the Microsoft Bing knowledge repository to identify the products, brands, and organizations to display. Using this insight, you can identify whether any competitor brands and organizations are mentioned on the sales calls and update your sales strategies accordingly.
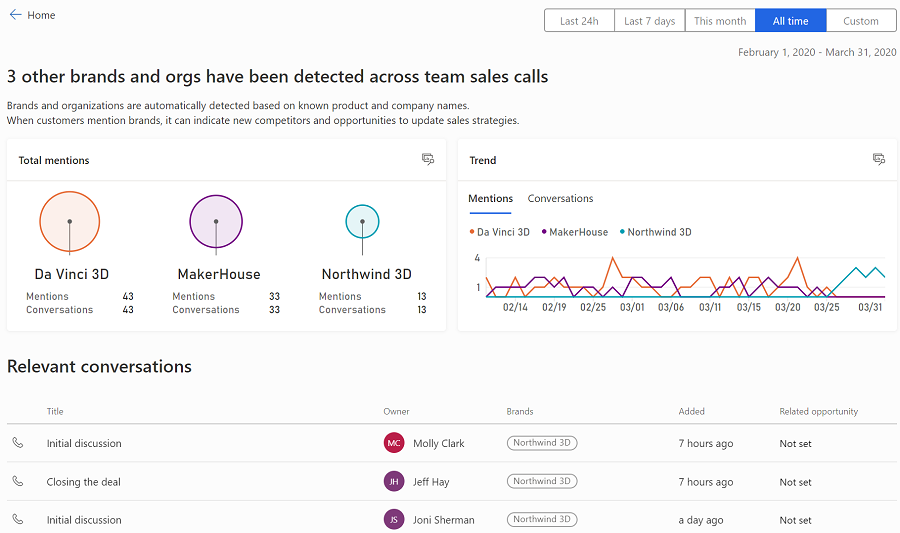
The following image is an example of how the "brands and organizations detected" insight is displayed.

In this example, you can see that three brands and organizations (Da Vinci 3D, MakerHouse, and Northwind 3D) are trending most in sales calls. You can update the sales strategies to coach your sales teams to minimize the mention of these brands in the calls. The bubbles show the 20 brands that are used most and the number of times that these brands and organizations were mentioned in the calls.
Select Show details to view more details on top brands and organizations. The details include how many times each brand and organization is mentioned in the total number of calls, the trend of each brand and organization over time, and the list of calls that are contributing in analyzing the brands and organizations. Furthermore, you can select each call and view the summary. To learn more about call summary, see View and understand call summary.
What characterizes top sellers?
The What characterizes top sellers section helps you understand the conversational behavior of your top sellers. The insights are generated based on the revenue that the top sellers generate. For example, Bart and John are sellers, and they generate more than average revenue on your team. The insights in this section are generated based on the conversational behavior of Bart and John.
By analyzing these insights, you can understand what makes the top sellers most effective in generating revenue. You can apply this knowledge to coach other sellers on how to generate revenue more effectively.
The following insights are available for you to understand what characterizes top sellers:
Average talk-to-listen ratio
This insight shows the average time top sellers spend talking instead of listening to customers compared to the rest of the sales team. By analyzing this insight, you can understand what works for top sellers to close deals and generate revenue.
The following image is an example of how the "talk-to-listen ratio" insight is displayed.

In this example, you can observe that when comparing how much they talk compared to how much they listen, the top sellers talk less than the team does on average (59 percent compared to 61 percent), and they listen more than the team does on average (41 percent compared to 39 percent). Through this insight, you can learn that talking less is helping the top sellers generate revenue, and you can suggest it as a best practice for other sellers to follow.
Select Show details and the Teams overview page opens, with details on each seller's talk-to-listen ratio with customers.
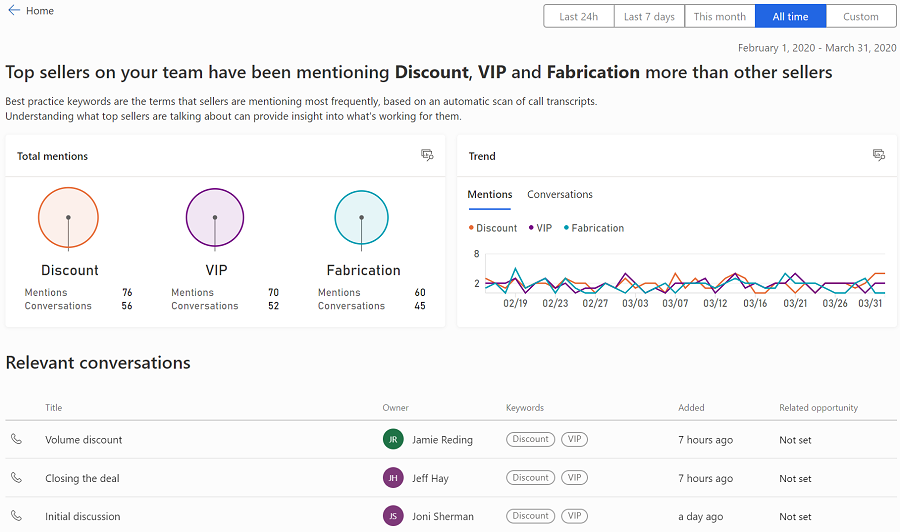
Best practice keywords
This insight shows the keywords that the top sellers use more frequently in conversations with customers. By analyzing this insight, you can understand what words the top sellers use that help them to close deals and generate revenue.
The following image is an example of how the "what are they talking about" insight is displayed.

In this example, you can see that Discount, VIP, and Fabrication are the top words mentioned by your top sellers. The bubbles show the top 20 trending keywords and the number of times these keywords were mentioned in the calls.
Select Show details to view more details on the top best practice keywords. The details include how many times each best practice keyword is mentioned in the total number of calls, the trend of each best practice keyword over time, and the list of calls that are contributing in analyzing the keywords. Furthermore, you can select each call and view the summary. To learn more about call summary, see View and understand call summary.
Customer sentiment
This insight shows how top sellers are doing when compared to the team in terms of positive, neutral, and negative customer sentiments during sales calls. Using this insight, you can analyze what makes the top sellers more efficient in addressing the customer's pain points during the call and how you can coach your other sellers to align their sentiment levels with your top sellers.
The following image is an example of how the "customer sentiment" insight is displayed.

In this example, you can see that top sellers are driving more negative customer sentiment (28 percent) compared to the team as a whole (26 percent). This indicates that top sellers might be asking more questions to identify the customer's pain points, in order to resolve them and key out selling opportunities.
Select Show details and the Teams overview page opens, with details on customer sentiment.
Switch rate
This insight shows the rate at which top sellers are talking and listening in conversations with customers. Using this insight, you can understand the switch rate of top sellers per hour and identify coaching opportunities for other sellers to improve their switch rate.
The following image is an example of how the "switch rate" insight is displayed.

In this example, you can see that top sellers are switching less during the conversation with customers (33 times per hour) than the team average (34 times per hour). Through this, you can identify coaching opportunities for the other sellers to improve their switch rates during customer conversations.
Select Show details and the Teams overview page opens, with details on each seller's switch rates with customers compared to the team average.
Engagement with customers
This insight helps you understand what type of communication mode top sellers spend their time in while engaging with customers. Using this insight, you can identify coaching opportunities for other sellers on the communication mode they use.
The following image is an example of how the "engagement with customers" insight is displayed.

In this example, you can see that top sellers are spending more time engaging with customers on email (23 hours) than in phone calls (1 hour) or meetings (6 hours). By analyzing this, you see that top sellers are engaging customers through email, so you can plan to coach around these communication modes for other sellers to improve.
Call recording KPIs
The call recording KPIs provide an understanding of how calls are trending month over month. By viewing these KPIs, you'll know the total number of:
The number of calls that are recorded, and how that's trending.
The number of hours that calls were recorded, and how that's trending.
Calls that mention the keywords you're tracking, and how they're trending.
Calls that mention the brands and competitors you're tracking, and how they're trending.
The following image shows how the call recording KPIs are displayed.

Can't find the options in your app?
There are three possibilities:
- You don't have the necessary license or role.
- Your administrator hasn't turned on the feature.
- Your organization is using a custom app. Check with your administrator for exact steps. The steps described in this article are specific to the out-of-the-box Sales Hub and Sales Professional apps.
See also
Administer conversation intelligence
Improve seller coaching and sales potential with conversation intelligence
Dashboards in Dynamics 365 Customer Service
Conversation Topics dashboard in Dynamics 365 Customer Service
Feedback
Coming soon: Throughout 2024 we will be phasing out GitHub Issues as the feedback mechanism for content and replacing it with a new feedback system. For more information see: https://aka.ms/ContentUserFeedback.
Submit and view feedback for