Explore Power BI Desktop
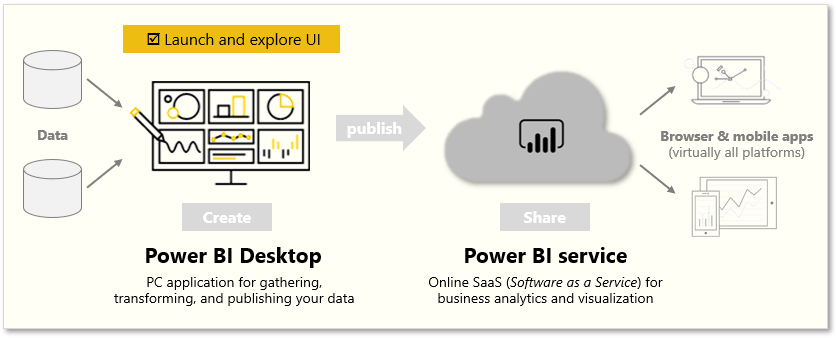
The idea of building and sharing reports is an abstract concept. It will make more sense if you explore Power BI Desktop hands-on. The first step is to launch and explore the user interface (UI).
In this unit, you will:
- Launch the Power BI Desktop.
- Explore the UI.
Note
To follow along with the examples in this module, download the sample Excel workbook here and import into Power BI Desktop (Get Data > Excel) if you haven't already.
Launch Power BI Desktop
When you launch Power BI Desktop, the Getting Started dialog box will appear, which provides useful links to forums, blogs, and introductory videos. Close this dialog box for now, but keep the Show this screen on startup option selected so that you can explore it later.
Explore the report building environment
In Power BI Desktop, you'll begin to build reports in the Report view. You'll be working in five main areas:
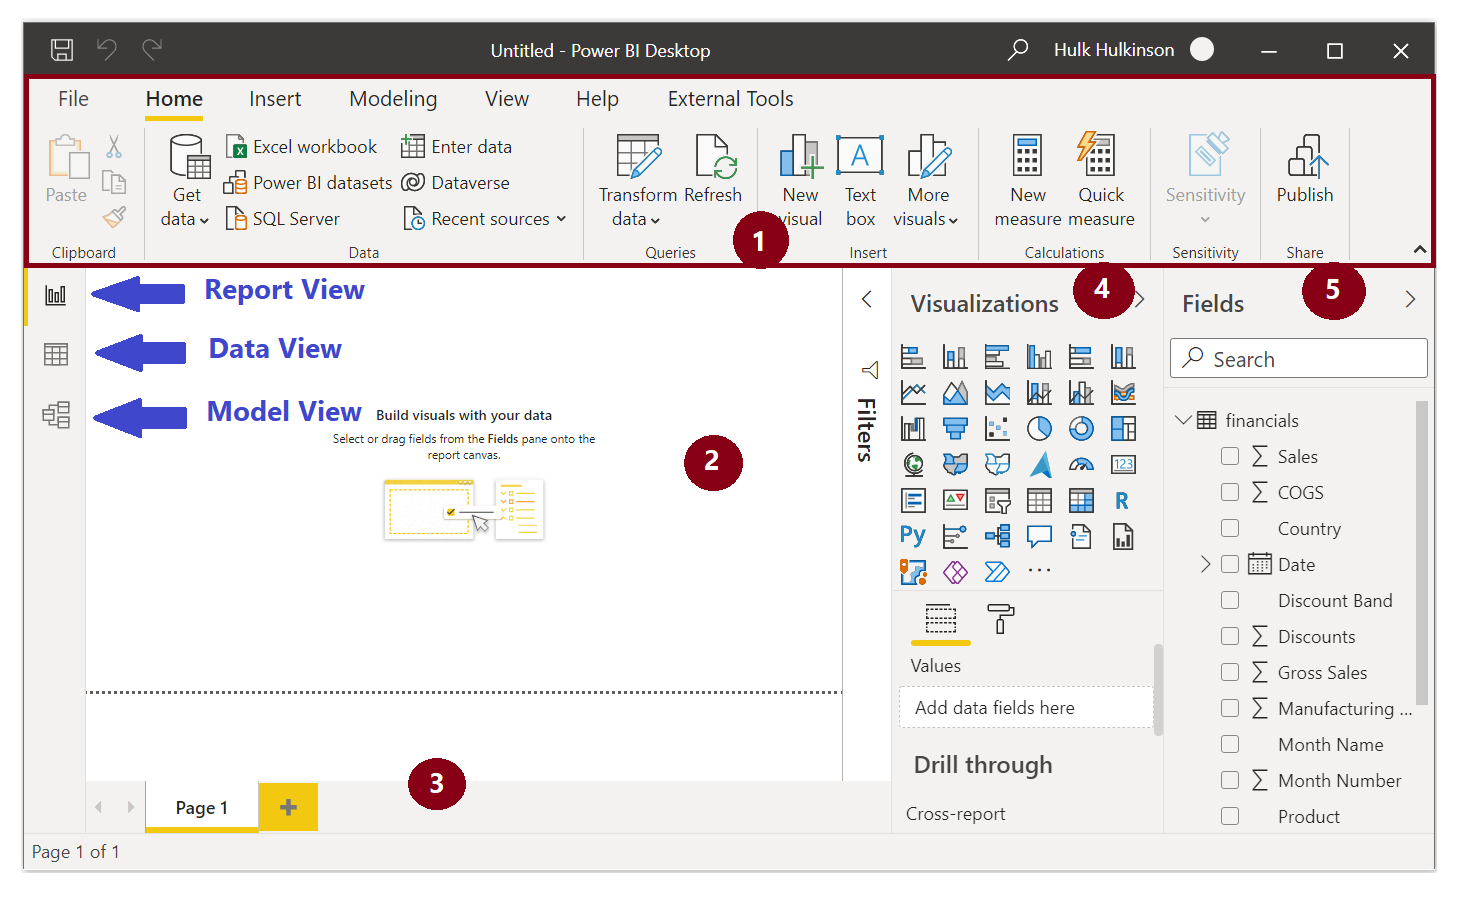
- Ribbon - Displays common tasks that are associated with reports and visualizations.
- Report view, or canvas - Where visualizations are created and arranged. You can switch between Report, Data, and Model views by selecting the icons in the left column.
- Pages tab - Located along the bottom of the page, this area is where you would select or add a report page.
- Visualizations pane - Where you can change visualizations, customize colors or axes, apply filters, drag fields, and more.
- Fields pane - Where query elements and filters can be dragged onto the Report view or dragged to the Filters area of the Visualizations pane.
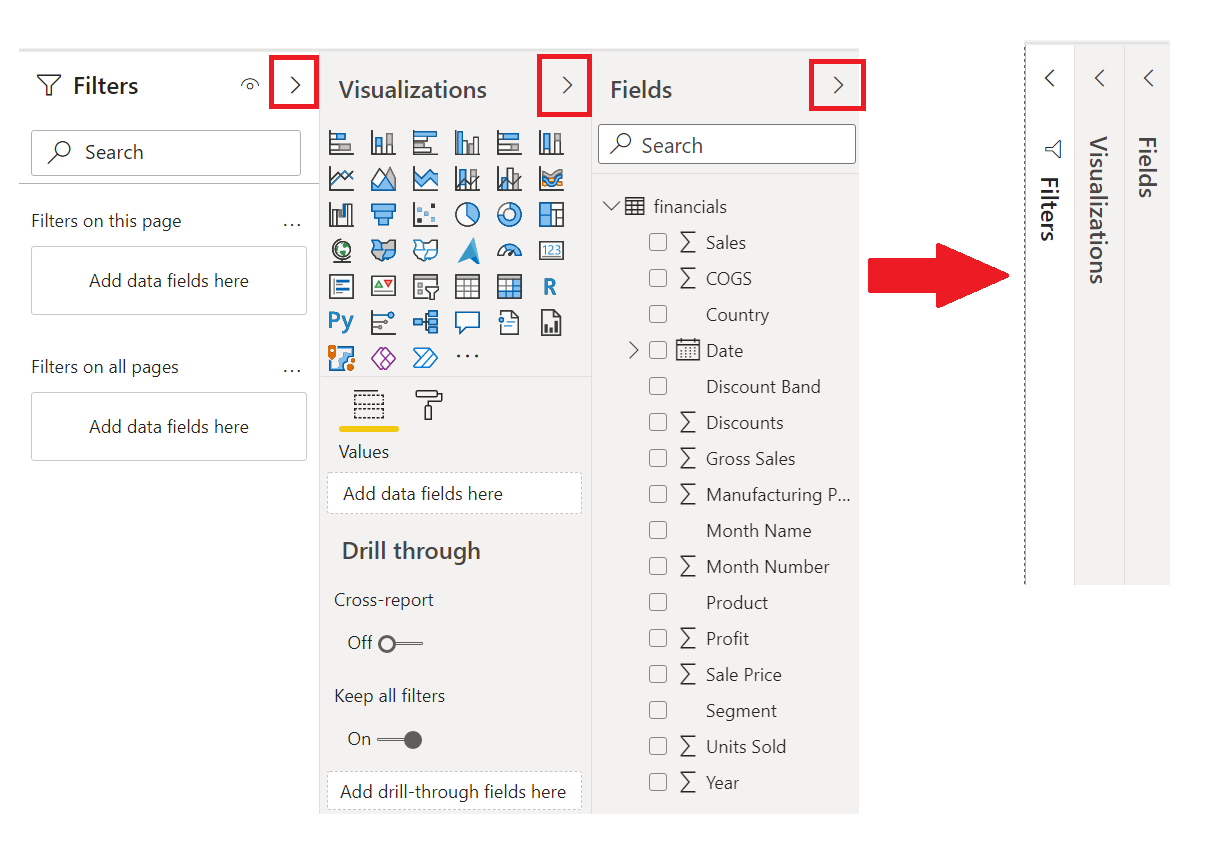
Tip
You can collapse the Visualizations and Fields panes to provide more space in the Report view by selecting the small arrow, as shown in the following screenshot.
Create a visual
To create a visual, drag a field from the Fields list onto the Report view.

For example, Power BI Desktop automatically created a map-based visualization because it recognized that the Country field contained geolocation data.
Publish a report
After creating a report with a few visuals, you're ready to publish to the Power BI service. On the Home ribbon on the Power BI Desktop, select Publish.

You’ll be prompted to sign in to Power BI. When you've signed in and the publish process is complete, the following dialog box will appear. You can select the link below Success!, which will take you to the Power BI service, where you can see the report that you published.

Pin a visual to a dashboard
When you view a published report in the Power BI service, you can choose the Pin icon to pin that visual to a dashboard.
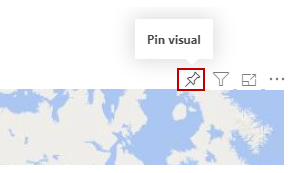
You can choose whether to pin the visual to an existing dashboard or to create a new dashboard.
For more information, see Report View in Power BI Desktop.