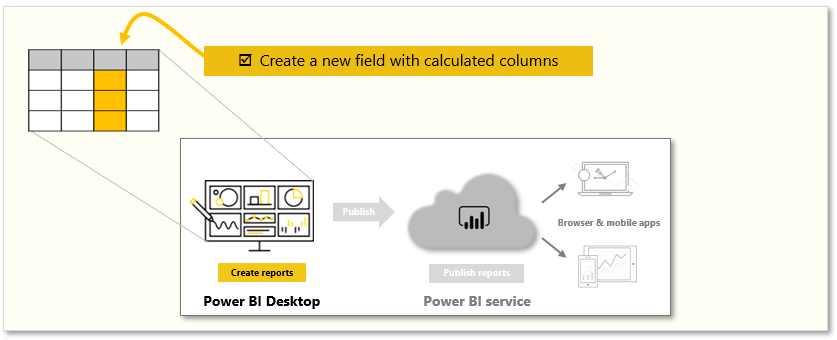
Create calculated columns
Sometimes, the data that you're analyzing doesn't contain a field that you need. The answer might be calculated columns. You can create a new calculated column by transforming two or more elements of existing data. For example, you can create a new column by combining two columns into one.
Tasks in this unit include:
Note
To follow along with the examples on this page, download the sample Access database here and import into Power BI Desktop (Get Data > Database > Access database). If you have any issues loading the Access database, please read this article.
One reason for creating a calculated column is to establish a relationship between tables when no unique fields exist. The lack of a relationship becomes obvious when you create a simple table visual in Power BI Desktop and get the same value for all entries.
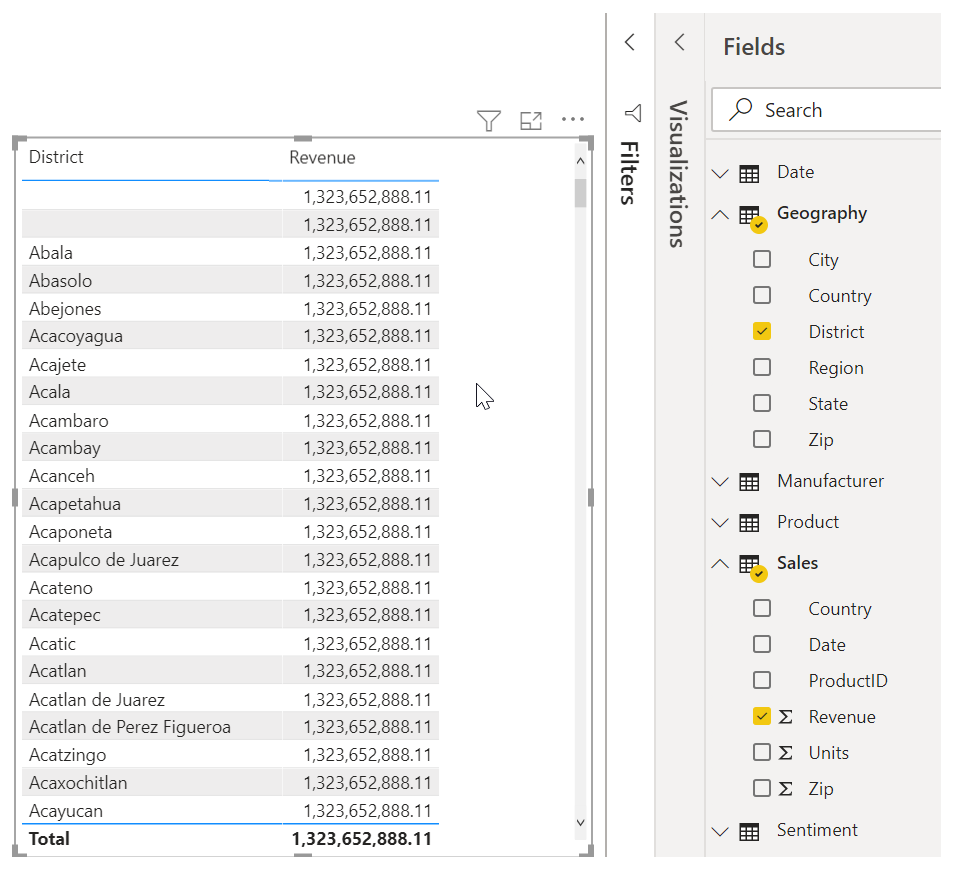
For example, to create a relationship with unique fields in data, you can create a new calculated column for "CountryZip" by combining the values from the Country and the Zip columns.
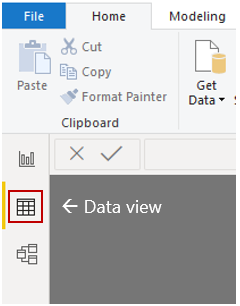
To create a calculated column, select the Data view in Power BI Desktop from the left side of the report canvas.
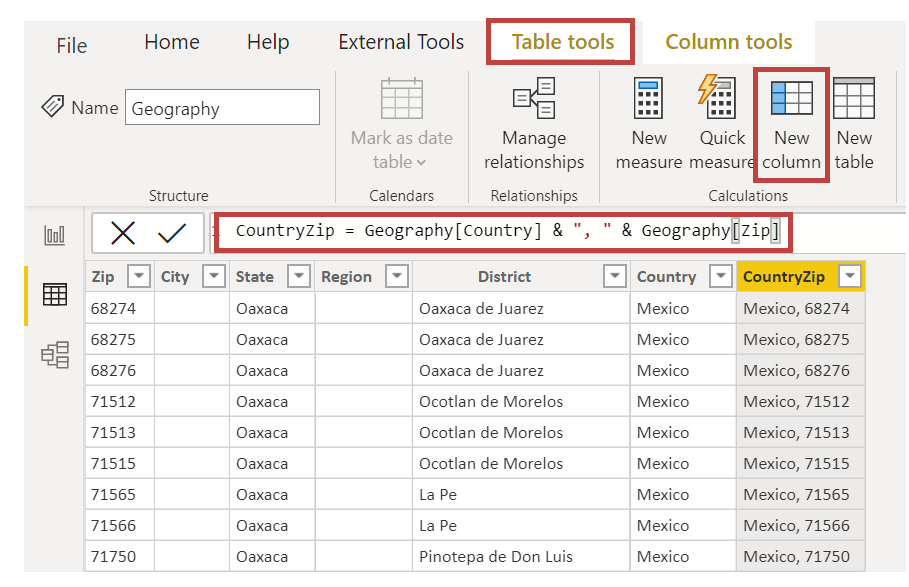
From the Table tools tab, select New Column to enable the formula bar. You can enter calculations by using Data Analysis Expressions (DAX) language. DAX is a powerful formula language that lets you build robust calculations. As you type a formula, Power BI Desktop displays matching formulas or data elements to assist and accelerate the creation of your formula.
The Power BI formula bar will suggest specific DAX functions and related data columns as you enter your expression.
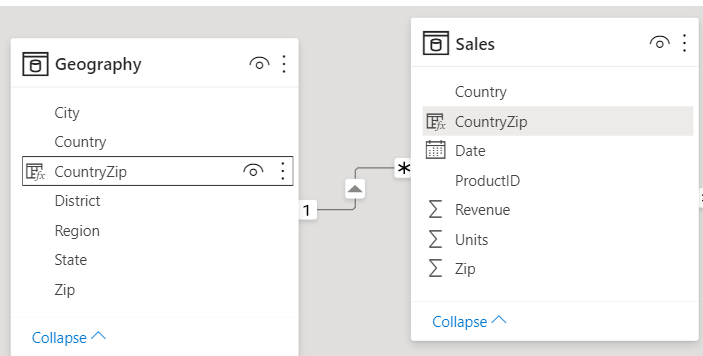
After you have created the new CountryZip calculated column in the Geography table and the Sales table, they can be used as a unique key to establish a relationship between the two tables. By going to the Relationship view, you can then drag the CountryZip field from the Sales table to the Geography table to create the relationship.
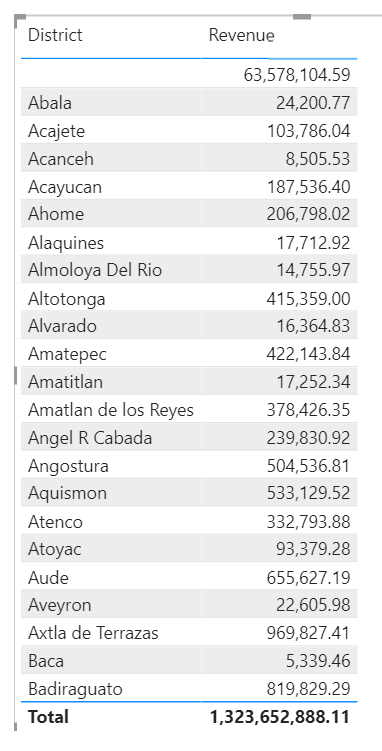
When you return to the Report view, notice that a different value for each district shows.
For more information on calculated columns, including the use of IF statements, see Tutorial: Create calculated columns in Power BI Desktop.