Office Telemetry Dashboard worksheets
Applies to: Office 2019, Office 2016
Important
- Office Telemetry Dashboard is no longer supported in Microsoft 365 Apps for enterprise (as of Version 2208), and is removed in Version 2301 (and later).
- For more information, see Removal of Office Telemetry Dashboard from Microsoft 365 Apps for enterprise.
As you use Office Telemetry Dashboard to investigate stability issues for Office documents and Office solutions, you might need more information about the data that is displayed in the worksheets. Use this article as a guide to help understand the data that is shown in Office Telemetry Dashboard. This data helps you identify stability issues for Office documents and solutions and helps you track Office deployments. You can also use this data to identify problems with the agents and processors used by Office Telemetry Dashboard.
Important
- Office Telemetry Dashboard is an on-premises tool that collects inventory, usage, and health data about the Office documents and solutions, such as add-ins, used in your organization. The data is primarily designed to help your organization with application compatibility testing.
- Data collected for Office Telemetry Dashboard is stored in a SQL Server database controlled by your organization and the data collected is not sent to Microsoft. For more information, see Data collected by the agent for Office Telemetry Dashboard.
- Data collected for Office Telemetry Dashboard is different than Office diagnostic data, which can be sent to Microsoft. For more information about Office diagnostic data, see Overview of privacy controls for Microsoft 365 Apps.
- Settings used to manage Office Telemetry Dashboard have no impact on Office diagnostic data and vice versa. For more information about managing Office diagnostic data, see Use policy settings to manage privacy controls for Microsoft 365 Apps.
Overview worksheet
The Overview worksheet provides a big picture view of both the stability and deployment status of Office within your organization. By using this worksheet, you can quickly understand how your critical documents and solutions are behaving on users' computers. Instead of browsing the Documents and Solutions worksheets, which show you item-by-item status, you can open and refresh the Overview worksheet to see a high-level view of document and solution stability. The following screenshot shows the Overview worksheet:
Overview worksheet in Office Telemetry Dashboard
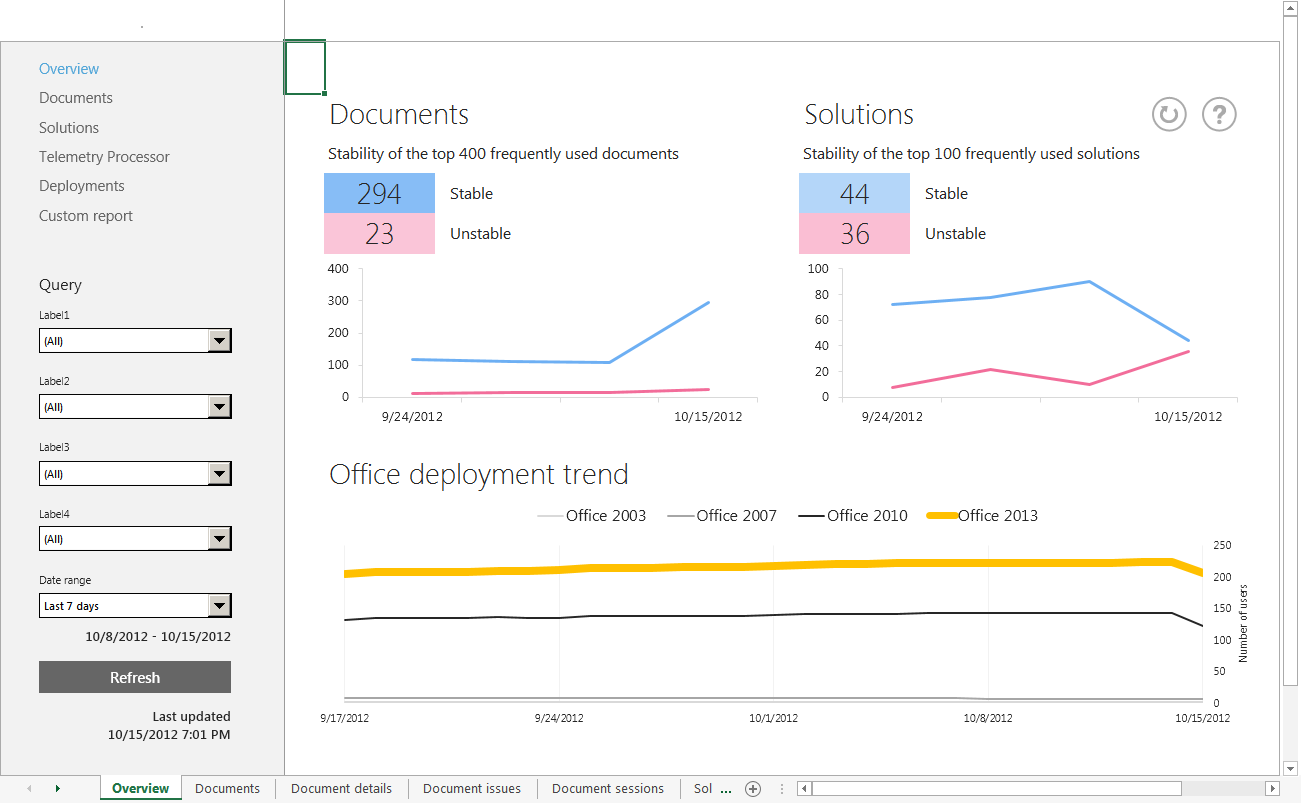
There are three primary tasks that you can perform on the Overview worksheet.
Determine the overall stability of Office documents and solutions throughout your organization
Drill down to investigate unstable documents or solutions that require your attention
View the progress of Office deployments in your organization
Documents worksheet
The Documents worksheet in Office Telemetry Dashboard displays the list of documents that was collected by logging and by agent scans. In this worksheet, you can find frequently used documents and data about them.
The following screenshot shows the Documents worksheet.
Documents worksheet in Office Telemetry Dashboard

There are two main sections on the Documents worksheet:
Office usage
Office 2016 and later telemetry data
The columns under the Office usage section display usage data that is collected by the agent for Office Telemetry Dashboard. You can select the link for the number of users of a document to see who is using the document. This information is displayed in the Document details worksheet.
The columns under the Office 2016 and later telemetry data section display data that is collected by logging. You can select the link for the number of users who hit critical or informative issues to see more details. This information is displayed in the Document issues worksheet.
The following table describes each column in the Documents worksheet.
Note
By default, some columns are collapsed and not visible. Select the [+] symbols on the top row to expand the columns.
Column descriptions for the Documents worksheet in Office Telemetry Dashboard
| Section | Column | Description |
|---|---|---|
| Office usage |
File name |
Shows the file name of each document. |
| Total users |
Shows the number of users who opened each document by using Office 2003, Office 2007, Office 2010, Office 2013, Office 2016, or Office 2019. |
|
| Office 2003 |
Shows the number of users who opened each document by using Office 2003. |
|
| Office 2007 |
Shows the number of users who opened each document by using Office 2007. |
|
| Office 2010 |
Shows the number of users who opened each document by using Office 2010. |
|
| Office 2013 |
Shows the number of users who opened each document by using Office 2013. |
|
| Office 2016 and later |
Shows the number of users who opened each document by using Office 2016 or Office 2019. |
|
| Office 2003 (computers) |
Shows the number of computers on which users opened each document by using Office 2003 |
|
| Office 2007 (computers) |
Shows the number of computers on which users opened each document by using Office 2007. |
|
| Office 2010 (computers) |
Shows the number of computers on which users opened each document by using Office 2010. |
|
| Office 2013 (computers) |
Shows the number of computers on which users opened each document by using Office 2013. |
|
| Office 2016 and later (computers) |
Shows the number of computers on which users opened each document by using Office 2016 or Office 2019. |
|
| Office 2016 and later telemetry data |
Success (%) |
Shows the percentage of successfully opened documents (no critical errors occurred) out of the total number of sessions. |
| Sessions |
Shows the total number of sessions. A session refers to all selected file open events. |
|
| Trend |
Shows the trend of changes that occurred between the current week and a week within the selected period. You can change the period by using the Date range filter in the navigation pane. For example, if you select 1 year from the Date range, the column shows a trend that compares the current week to a week from one year prior. |
|
| Critical |
Shows the number of users who encountered critical issues. |
|
| Critical issues |
Shows the number of unique critical issues. |
|
| Informative |
Shows the number of users who encountered informative issues. |
|
| Informative issues |
Shows the number of unique informative issues. |
|
| Application |
Shows the name of the application that was used to open each document. |
|
| Extension |
Shows the file name extensions that were used to open each document. |
|
| Built-in |
Indicates whether each document is included with Office or has a default file name that is used for Office documents. You can use the filter for this column to hide built-in documents so that you can see the unique documents in your organization. |
The following sections describe worksheets that help you drill down into specific issues. These worksheets appear after you select links within the Documents worksheet.
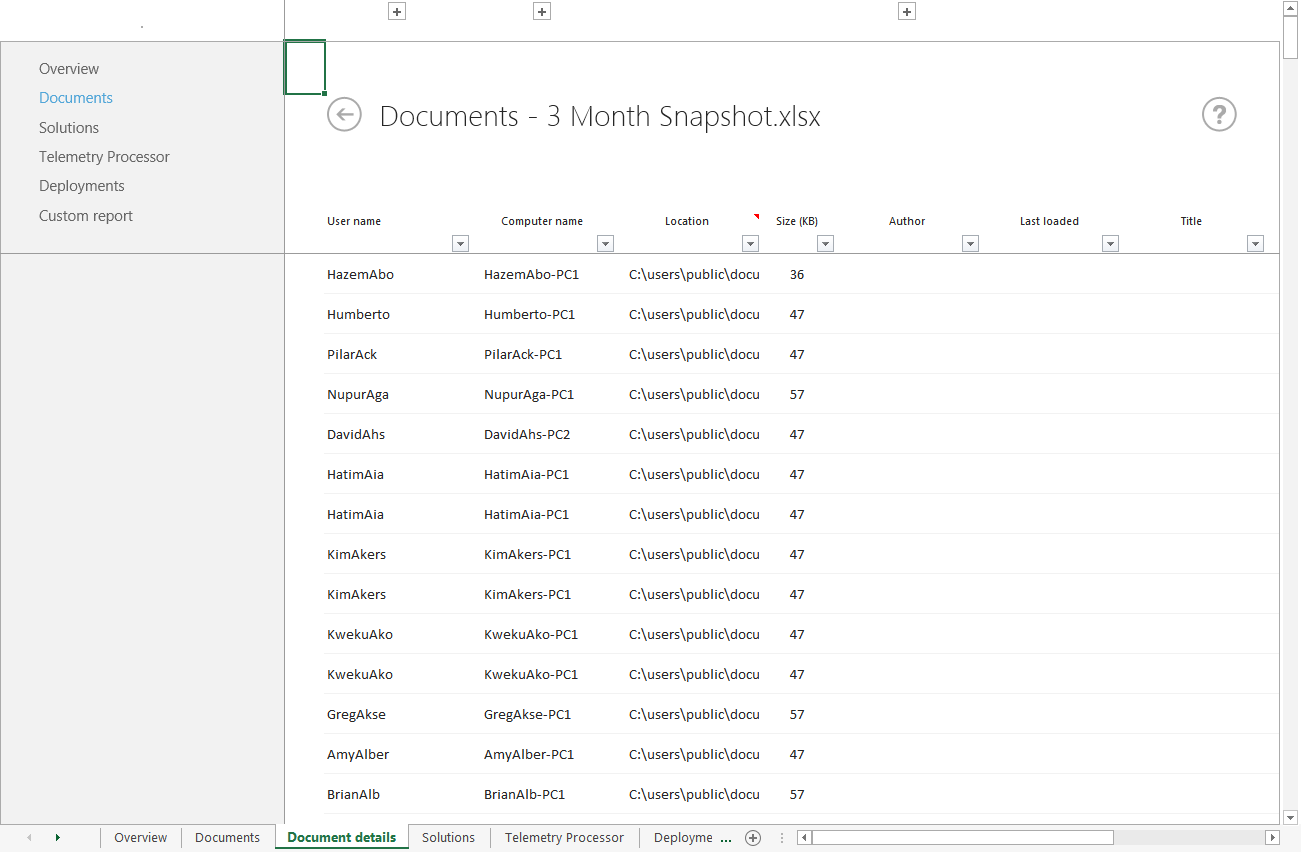
Document details worksheet
The Document details worksheet appears after you select a link under Office usage on the Documents worksheet. The Document details worksheet helps you see which users are frequently using a document.
The following screenshot shows the Documents details worksheet.
Document details worksheet in Office Telemetry Dashboard
The following table describes each column in the Document details worksheet.
Column descriptions for the Documents details worksheet in Office Telemetry Dashboard
| Column | Description |
|---|---|
| User name |
Displays the name of the user who used the document. |
| User domain |
Displays the domain name for this user. |
| Computer name |
Displays the computer name that was used to open the document. |
| Computer domain |
Shows the computer's domain name. |
| Location |
Shows the file path of the document. Only one file path is kept per user and computer. If the same user opens the document from a different file path on the same computer, only the most recent file path is kept. |
| Size (KB) |
Shows the file size of the document. |
| Author |
Shows the author name of the document. |
| VBA |
Indicates whether the document contains VBA code. |
| OLE |
Indicates whether the document contains OLE objects. |
| External data connection |
Indicates whether the document has an external data connection. |
| ActiveX control |
Indicates whether the document contains ActiveX controls. |
| Assembly reference |
Indicates whether the document contains VSTO document-level customizations. |
| Last loaded |
Indicates when the document was most recently loaded. |
| Title |
Shows the title of the document. |
| Office version |
Shows the version of Office that was used to open the document. |
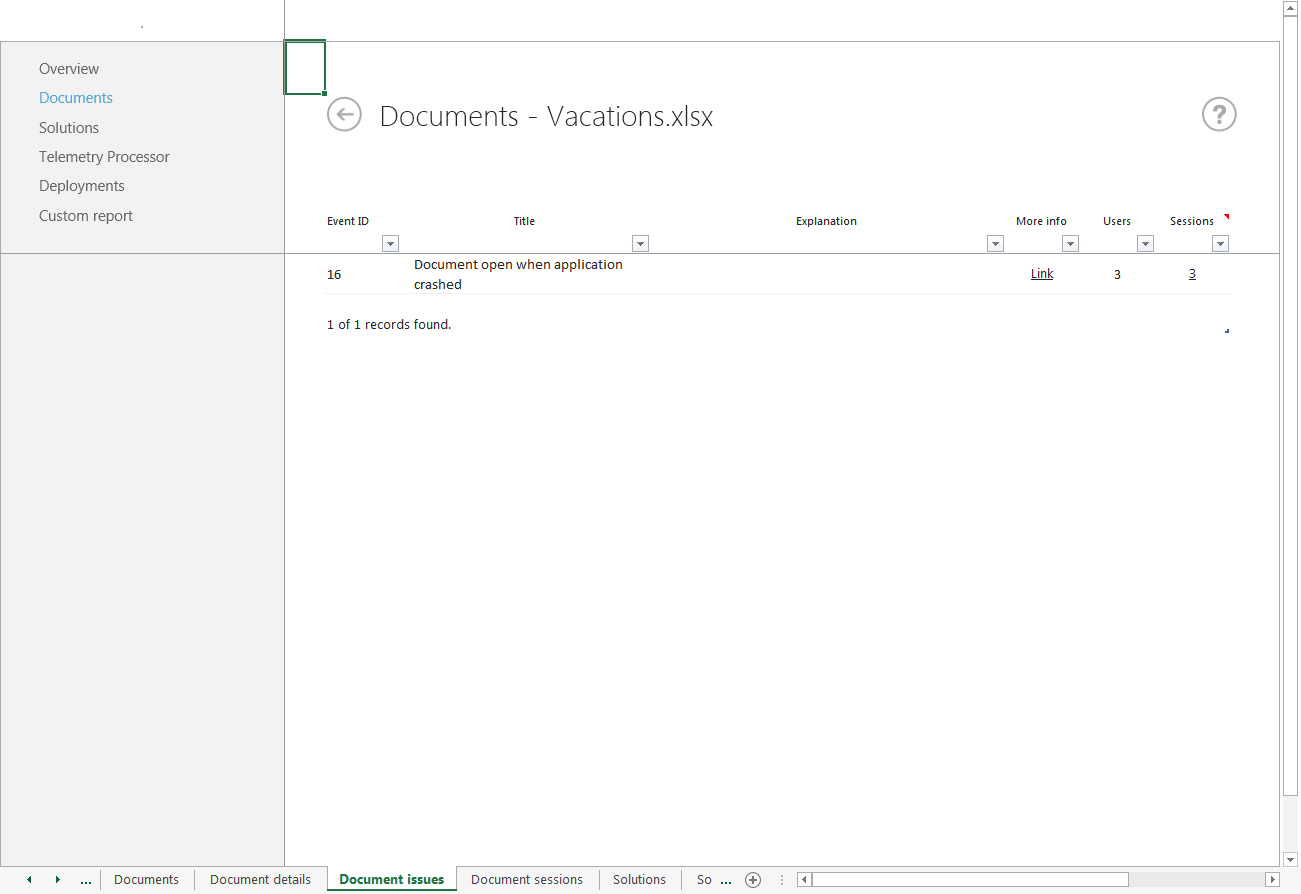
Document issues worksheet
The Document issues worksheet appears after you select a link under Office 2016 and later telemetry data on the Documents worksheet. The Document issues worksheet helps you find details about unique events that were found for a document.
The following screenshot shows the Document issues worksheet.
Document issues worksheet in Office Telemetry Dashboard
The following table describes each column in the Document issues worksheet.
Column descriptions for the Documents issues worksheet in Office Telemetry Dashboard
| Column | Description |
|---|---|
| Event ID |
Displays the Event ID. For more information about the event IDs, see "Table 2. Types of events displayed in the Telemetry Log" in Troubleshooting Office files and custom solutions with the telemetry log. |
| Title |
Shows the title of the issue. |
| Explanation |
Describes the issue. |
| More info |
Provides a link to more information. |
| Users |
Shows total number of users who encountered the issue. |
| Sessions |
Shows total number of sessions that encountered the issue. |
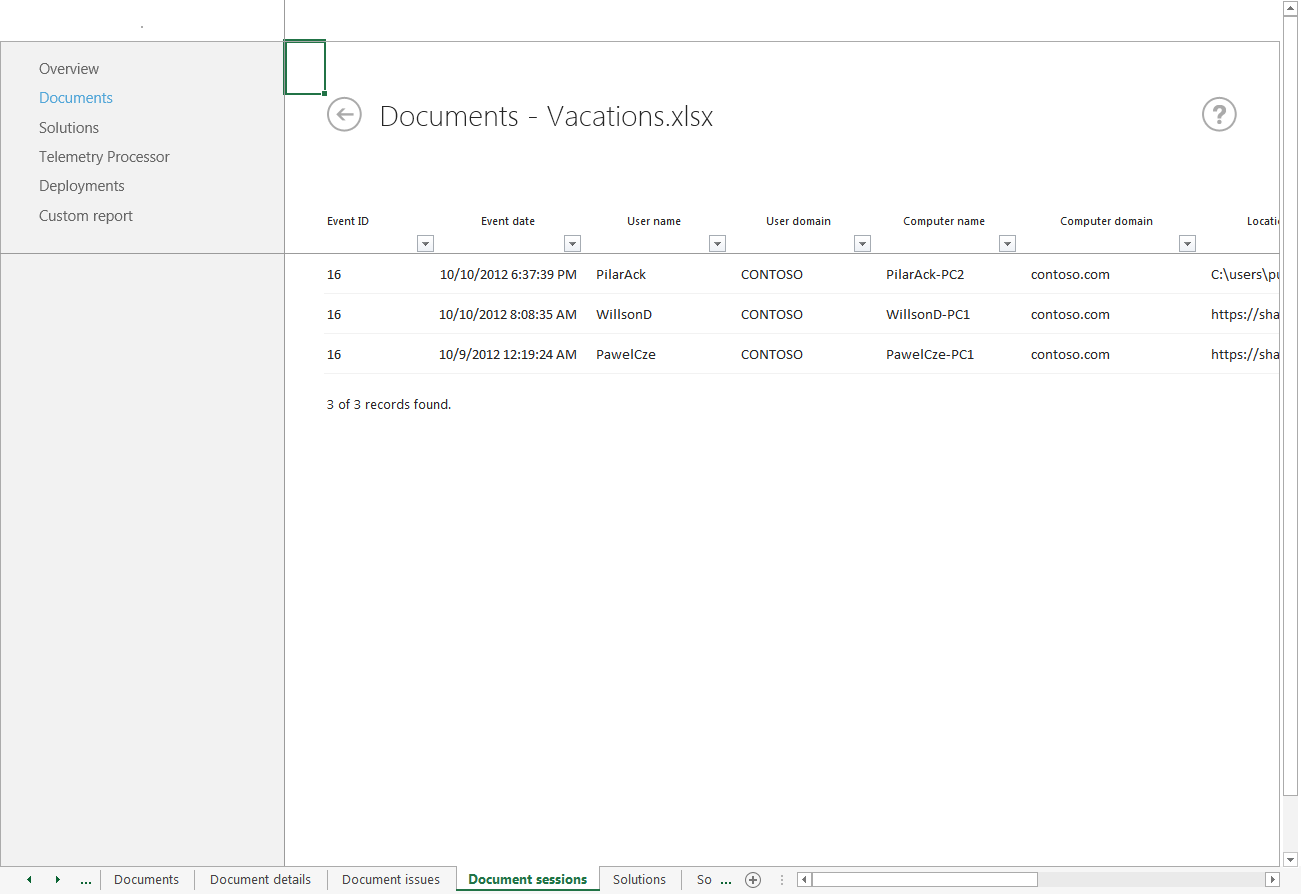
Document sessions worksheet
The Document sessions worksheet shows the sessions during which an issue occurred. You can open this worksheet by selecting a link in the Sessions column of the Document issues worksheet.
The following screenshot shows the Documents sessions worksheet.
Document sessions worksheet in Office Telemetry Dashboard
The following table describes each column in the Document sessions worksheet.
Column descriptions for the Documents sessions worksheet in Office Telemetry Dashboard
| Column | Description |
|---|---|
| Event ID |
Displays the Event ID. For more information about the event IDs, see "Table 2. Types of events displayed in the Telemetry Log" in Troubleshooting Office files and custom solutions with the telemetry log. |
| Event date |
Shows the date and time when the issue occurred. |
| User name |
Shows the names of users who were using the document that encountered the issue. |
| User domain |
Shows the domain name for the user. |
| Computer name |
Shows the name of the computer where the document encountered the issue. |
| Computer domain |
Shows the computer's domain name. |
| Location |
Shows the file path where the selected document was opened. Only one file path is kept per user and computer. If the same user opens the document from a different file path on the same computer, only the most recent file path is kept. |
| Office version |
Shows the version of Office that was used to open this document. |
| Documents loaded |
Shows the list of documents that were being used when the issue occurred. |
| Size (KB) |
Shows the size of the document. |
| Author |
Shows the name of the author of the document. |
| VBA |
Indicates whether the document contains VBA code. |
| OLE |
Indicates whether the document contains OLE objects. |
| External data connection |
Indicates whether the document has an external data connection. |
| ActiveX control |
Indicates whether the document contains ActiveX controls. |
| Assembly reference |
Indicate whether the document contains VSTO document-level customization. |
| Title |
Shows the title of the document. |
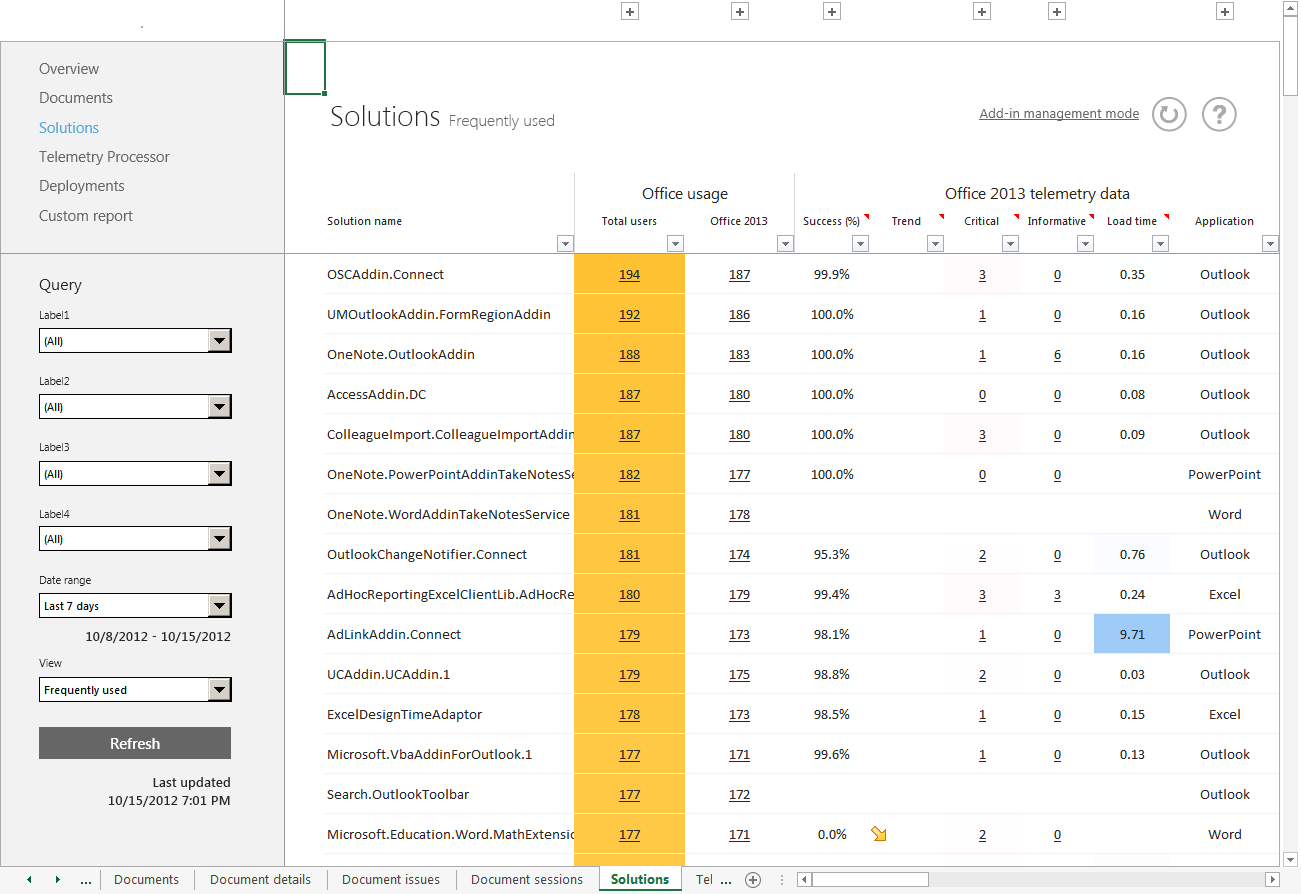
Solutions worksheet
The Solutions worksheet displays the list of solutions that was collected by logging and agent scans. In this worksheet, you can find frequently used solutions and data about them. The kinds of solutions that are shown include COM add-ins, application-specific add-ins, and apps for Office.
The following screenshot shows the Solutions worksheet.
Solutions worksheet in Office Telemetry Dashboard
After data is collected, you can manage Office add-ins by using the Add-in management mode link on the Solutions worksheet. For more information, see Let's manage add-ins using Telemetry Dashboard.
There are two main sections on the Solutions worksheet:
Office usage
Office 2016 and later telemetry data
The columns under the Office usage section display the usage data that is collected by the agent for Office Telemetry Dashboard. You can select the link for the number of users of a solution to see who is using the solution. This information is displayed on the Solution details worksheet.
The columns under the Office 2016 and later telemetry data section display data that is collected by logging. You can select the link for the number of users who hit critical or informative issues to see more details. This information is displayed on the Solution issues worksheet.
The following table describes each column in the Solutions worksheet.
Note
By default, some columns are collapsed and not visible. Select the [+] symbols on the top row to expand the columns.
Column descriptions for the Solutions worksheet in Office Telemetry Dashboard
| Section | Column | Description |
|---|---|---|
| Office usage |
Total users |
Shows the number of users who use the solution in Office 2003, Office 2007, Office 2010, Office 2013, Office 2016, or Office 2019. |
| Office 2003 |
Shows the number of users who use the solution in Office 2003. |
|
| Office 2007 |
Shows the number of users who use the solution in Office 2007. |
|
| Office 2010 |
Shows the number of users who use the solution in Office 2010. |
|
| Office 2013 |
Shows the number of users who use the solution in Office 2013. |
|
| Office 2016 and later |
Shows the number of users who use the solution in Office 2016 or Office 2019. |
|
| Total computers |
Shows the number of computers where the solution was opened by using Office 2003, Office 2007, Office 2010, Office 2013, Office 2016, or Office 2019. |
|
| Office 2003 (computers) |
Shows the number of computers where the solution was opened by using Office 2003. |
|
| Office 2007 (computers) |
Shows the number of computers where the solution was opened by using Office 2007. |
|
| Office 2010 (computers) |
Shows the number of computers where the solution was opened by using Office 2010. |
|
| Office 2013 (computers) |
Shows the number of computers where the solution was opened by using Office 2013. |
|
| Office 2016 and later (computers) |
Shows the number of computers where the solution was opened by using Office 2016 or Office 2019. |
|
| Office 2016 and later telemetry data |
Success (%) |
Shows the percentage of successfully opened solutions (no critical error occurred) out of total sessions. |
| Sessions |
Shows the total number of sessions. A session refers to all selected file open events. |
|
| Trend |
Shows the trend of changes that occurred between this week and a week within the selected period. You can change the period by using the Date range filter in the navigation pane. For example, if you select 1 year from the Date range, the column shows a trend that compares this week to a week from one year prior. |
|
| Critical |
Shows the number of users who encountered critical issues |
|
| Critical issues |
Shows the number of unique critical issues. |
|
| Informative |
Shows the number of users who encountered informative issues. |
|
| Informative issues |
Shows the number of unique informative issues. |
|
| Load time |
Shows the average load time of the solution. |
|
| Application |
Shows the application name that was used to open the selected solution. |
|
| Type |
Shows the solution type. |
|
| File |
Shows the file name of the solution. |
|
| Extension |
Shows the file name extensions of the solution. |
|
| Publisher |
Shows the publisher of the solution. |
|
| Built-in |
Indicates whether this solution is included with Office. You can use the filter for this column to hide built-in solutions so that you can see the unique solutions in your organization. |
The following sections describe worksheets that help you drill down into specific issues. These worksheets appear after you select links within the Solutions worksheet.
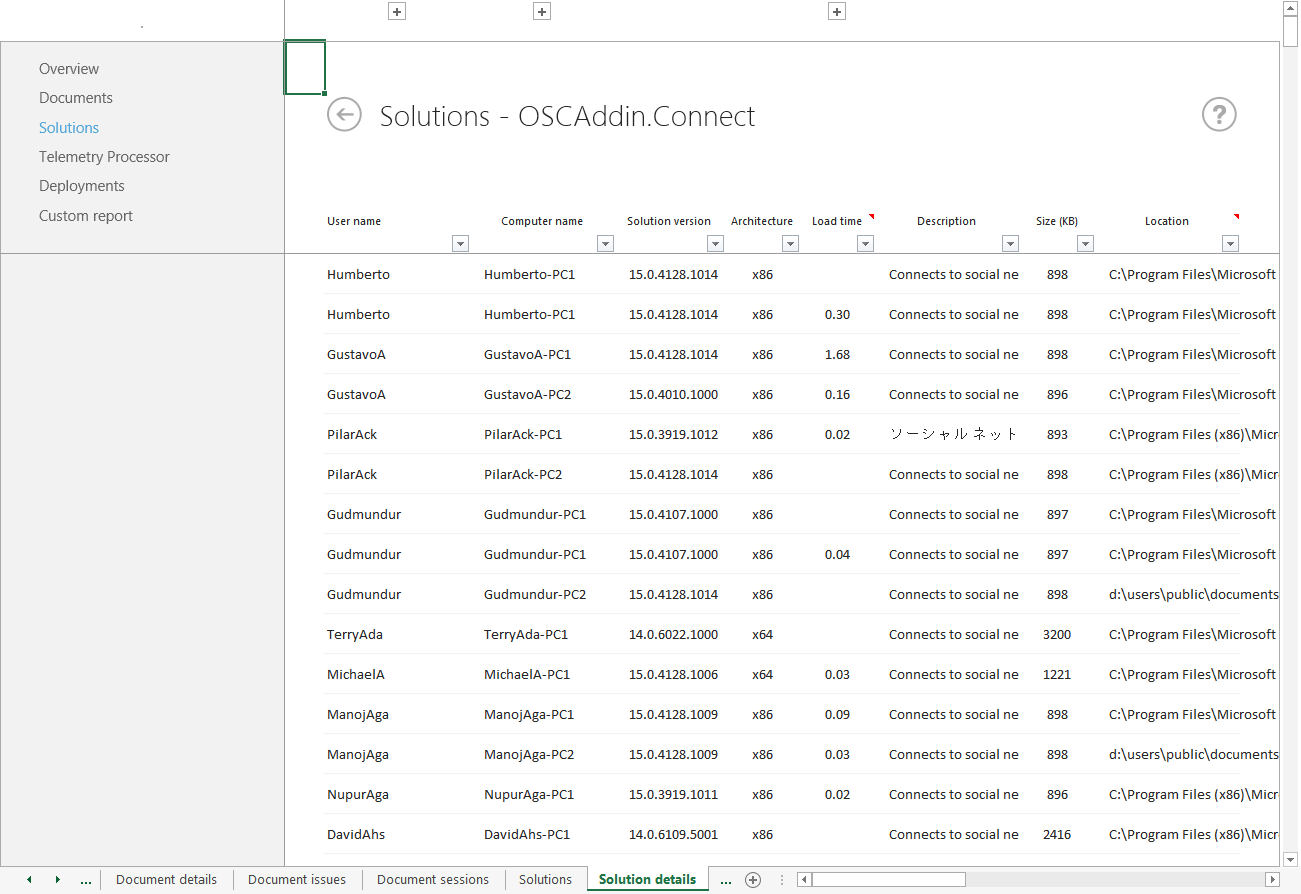
Solution details worksheet
The Solution details worksheet appears after you select a link under Office usage on the Solutions worksheet. The Solution details worksheet helps you see which users are frequently using a solution.
The following screenshot shows the Solution details worksheet.
Solution details worksheet in Office Telemetry Dashboard
The following table describes each column in the Solution details worksheet.
Column description for the Solution details worksheet
| Column | Description |
|---|---|
| User name |
Shows the name of user who used the solution. |
| User domain |
Shows the domain name for this user. |
| Computer name |
Shows the name of the computer where the solution was opened. |
| Computer domain |
Shows the computer's domain name. |
| Solution version |
Shows the version of the solution. |
| Architecture |
Shows the architecture of the solution. |
| Load time |
Shows how long the solution took to load. |
| Last loaded |
Shows the last time that the solution was loaded. |
| Load behavior |
Shows the load behavior of COM add-ins as follows: 0 - Do not load automatically (Unloaded) 1 - Do not load automatically (Loaded) 2 - Load at startup (Unloaded) 3 - Load at startup (Loaded) 8 - Load on demand (Unloaded) 9 - Load on demand (Loaded) 16 - Load first time, then load on demand (Loaded) For more information, see Load behavior values. |
| Policy setting |
Shows the policy setting. |
| Office version |
Shows the Office version that was used to open the solution. |
| Publisher |
Shows the publisher of the solution. |
| Author |
Shows the author name of the solution. |
| Friendly name |
Shows the friendly name of the solution. |
| Description |
Shows the description of the solution. |
| Size (KB) |
Shows the size of the solution. |
| Location |
Shows the file path of the solution.Only one file path is kept per user and computer. If the same user opens the solution from different file path on the same computer, only the most recent file path is kept. |
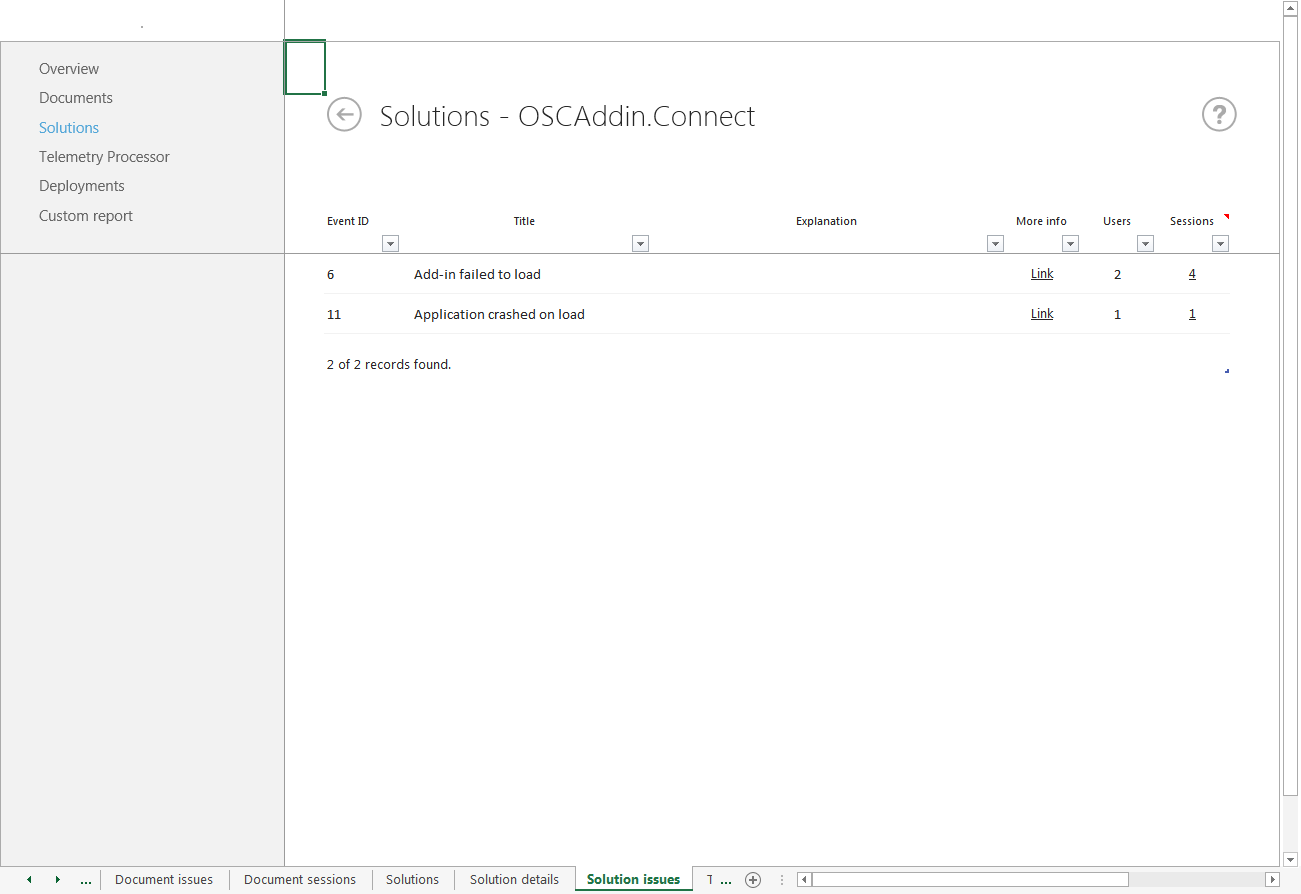
Solution issues worksheet
The Solution issues worksheet appears after you select a link under Office 2016 and later telemetry data on the Solutions worksheet. The Solution issues worksheet helps you find details about the unique events that were found for a solution.
The following screenshot shows the Solution issues worksheet.
Solution issues worksheet in Office Telemetry Dashboard
The following table describes each column in the Solution issues worksheet.
Column descriptions for the Solution issues worksheet in Office Telemetry Dashboard
| Column | Description |
|---|---|
| Event ID |
Displays the Event ID. For more information about the event IDs, see "Table 2. Types of events displayed in the Telemetry Log" in Troubleshooting Office files and custom solutions with the telemetry log. |
| Title |
Shows the title of the issue. |
| Explanation |
Describes the issue. |
| More info |
Provides a link to more information. |
| Users |
Shows the number of users who encountered the issue. |
| Sessions |
Shows the number of sessions that encountered the issue. |
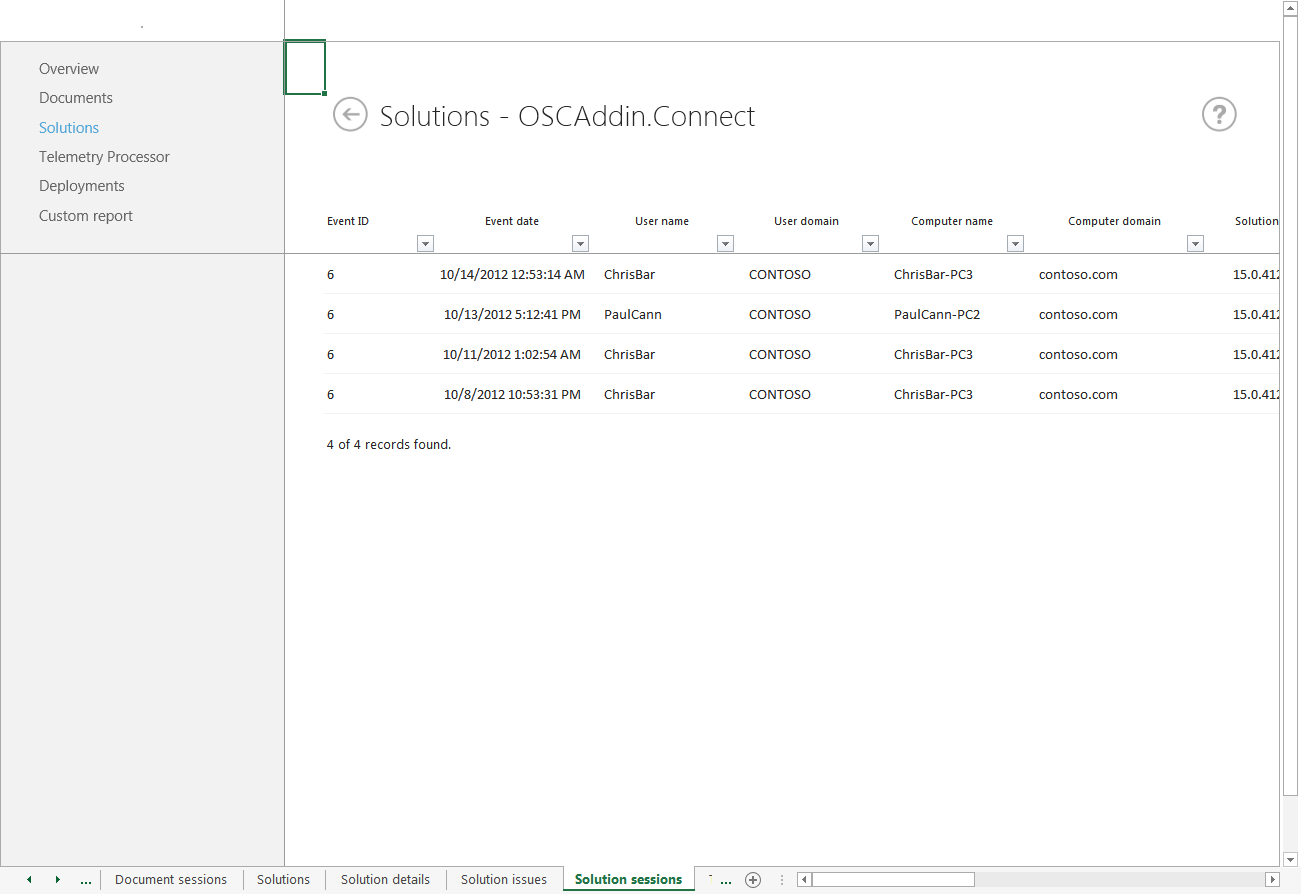
Solution sessions worksheet
The Solution sessions worksheet shows the sessions during which the issue occurred. You can open this worksheet by selecting a link in the Sessions column of the Solution issues worksheet.
The following screenshot shows the Solution sessions worksheet.
Solution sessions worksheet in Office Telemetry Dashboard
The following table describes each column in the Solution sessions worksheet.
Column descriptions for the Solution sessions worksheet in Office Telemetry Dashboard
| Column | Description |
|---|---|
| Event ID |
Displays the Event ID. For more information about the event IDs, see "Table 2. Types of events displayed in the Telemetry Log" in Troubleshooting Office files and custom solutions with the telemetry log. |
| Event date |
Shows the date and time when the issue occurred. |
| User name |
Shows the names of users who were using the solution that encountered the issue. |
| User domain |
Shows the domain name for the user. |
| Computer name |
Shows the name of the computer where the solution encountered the issue. |
| Computer domain |
Shows the computer's domain name. |
| Solution version |
Shows the version of the solution. |
| Architecture |
Shows the architecture of the solution. |
| Office version |
Shows the Office version with build numbers that used this solution. |
| Load time |
Shows how long the solution took to load. |
| Load behavior |
Shows the load behavior of COM add-ins as follows: 0 - Do not load automatically (Unloaded) 1 - Do not load automatically (Loaded) 2 - Load at startup (Unloaded) 3 - Load at startup (Loaded) 8 - Load on demand (Unloaded) 9 - Load on demand (Loaded) 16 - Load first time, then load on demand (Loaded) For more information, see Load behavior values. |
| Policy setting |
Shows the policy setting. |
| Document loaded |
Shows the documents that were open when the issue occurred. |
| Publisher |
Shows the publisher of the solution. |
| Author |
Shows the author name of the solution. |
| Friendly name |
Shows the friendly name of the solution. |
| Description |
Shows the description of the solution. |
| Size (KB) |
Shows the size of the solution. |
| Location |
Shows the file path of the solution. Only one file path is kept per user and computer. If the same user opens the solution from a different file path on the same computer, only the most recent file path is kept. |
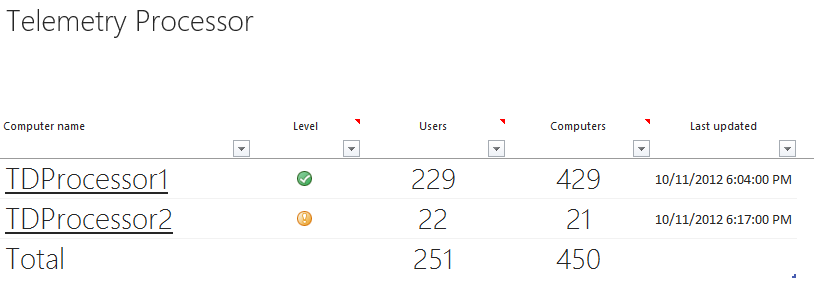
Telemetry Processor worksheet
The Telemetry Processor worksheet displays information about the health of the Office Telemetry Dashboard infrastructure. You can monitor whether processors are running correctly, and you can check whether users' computers are sending data correctly.
The following screenshot shows the Telemetry Processor worksheet:
Telemetry Processor worksheet in Office Telemetry Dashboard
The following table describes each column in the Telemetry Processor worksheet.
Column descriptions for the Telemetry Processor worksheet in Office Telemetry Dashboard
| Column | Description |
|---|---|
| Computer name |
Lists the names of computers that are running Telemetry Processor. You can select the computer name to see the users whose computers are sending data to each processor. For more information about this feature, see the Agents worksheet later in this article. |
| Level |
Shows the status of the processor. Depending on the status, you might want to investigate if the processor is running correctly or if the agents on users' computers are configured correctly and uploading data. The levels are described in the next table. |
| Users |
Shows the number of users whose computers are connected to each processor. |
| Computers |
Shows the number of computers that connected to each processor. |
| Last updated |
Shows the last date and time when the processor inserted data into the database. |
The following table describes the status that is represented by the symbols that are displayed in the Level column.
Icon descriptions for the Level column in the Telemetry Processor worksheet
| Symbol | Status description |
|---|---|
| The last updated date and time for the processor is less than a day ago. |
|
| 5% or more of the users for this processor have not uploaded data for the last 14 days. Select the processor name to open the Agents worksheet so that you can view which users' computers are not sending data. |
|
| The last updated date and time for the processor is older than a day. When you see this status, you should investigate whether the processor is running correctly on the computer. You find information about how to troubleshoot Office Telemetry Processor in Troubleshooting Office Telemetry Dashboard deployments. |
|
| (No symbol) |
The last updated date and time for the processor was more than 14 days ago. |
Note
A processor is deleted from the Telemetry Processors worksheet if the Last updated value for the processor is 90 or more days ago.
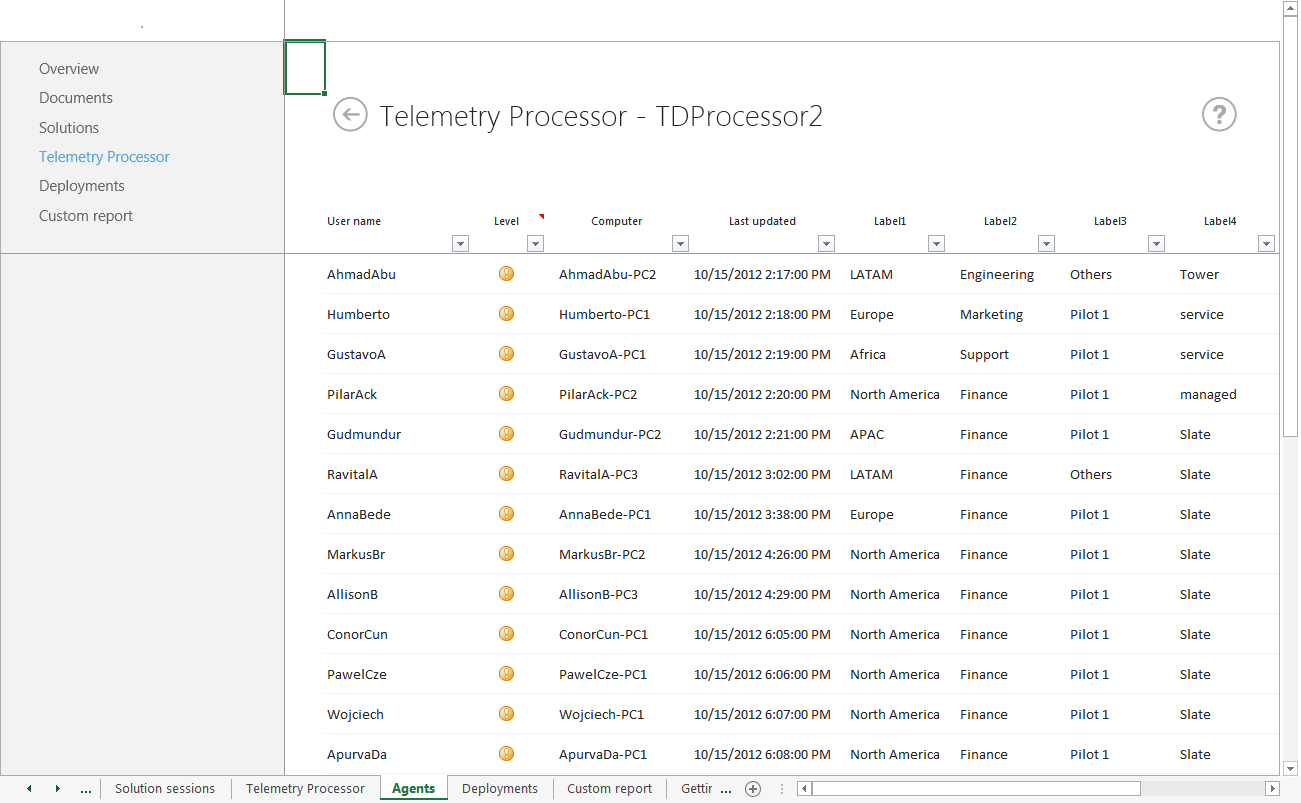
Agents worksheet
The Agents worksheet displays information about the users whose computers who are uploading data to each processor. You can open the Agents worksheet by selecting a link for a computer name on the Telemetry Processor worksheet. Use this worksheet to monitor the upload status of each computer.
The following screenshot shows the Agents worksheet.
Agents worksheet in Office Telemetry Dashboard
The following table describes each column in the Agents worksheet.
Column descriptions for the Agents worksheet in Office Telemetry Dashboard
| Column name | Description |
|---|---|
| User name |
Lists the names of users whose computers upload data to the processor. |
| Level |
Indicates how recently the agent uploaded data. The levels are described in the next table. |
| Computer |
Lists the names of the computers that upload data. |
| Last updated |
Shows the last date and time when the user's computer uploaded data. |
| Label 1 - 4 |
Shows the tag values that are assigned to each user. |
| Version |
Shows the major and minor version of the agent that runs on the user's computer. |
The following table describes the status that is represented by the symbols that are displayed in the Level column.
| Symbol | Status description |
|---|---|
| The last updated date and time for the user is less than a day ago. |
|
| The last updated date and time for the user is between 2 and 14 days ago. Occasionally, you will see this icon when the user's computer has not uploaded data for more than a day (for example, Monday morning after the weekend). |
|
| The last updated date and time for the user is between 15 and 30 days ago. When you see this status, you should investigate whether the agent on this user's computer is configured correctly. You find information about how to troubleshoot agents in Troubleshooting Telemetry Dashboard deployments. |
|
| (No symbol) |
The last updated date and time for the processor was 31 or more days ago. |
Note
A user is deleted from the Agents worksheet if the Last updated value for the user was 90 or more days ago.
Deployments worksheet
The Deployments worksheet provides a tabular view of the number of Office clients that are deployed in your organization. This worksheet provides additional information for the deployment trend chart that is shown in the Overview worksheet. This information can help you plan for future Office deployments.
In the following screenshot of the Deployments worksheet, you can see how many Office clients are deployed. The list is organized by Office version and CPU architecture. For example, you can see how many users are running 32-bit versions of Office.
Deployments worksheet in Office Telemetry Dashboard

You can see that there are still 32-bit computers that are running Office 2003. You may want to contact these users to understand if they have any concerns about how to upgrade. You can also create a custom report to show more information about these users, such as their computer hardware.
Also, you should be aware that Windows 8.1 is now supported on ARM-based architectures. If your organization has users who have Office on these computers, you can now keep track of that information in the Deployments worksheet. You can create custom reports to obtain richer information about who is using these computers, what issues they may be experiencing, and so on.
Note
Support for Windows 8.1 ended on January 10, 2023.
Custom report worksheet
When you select the Create custom report button on the Custom report worksheet, Telemetry Dashboard connects to multiple tables and creates relationships for you to use in a PivotTable. If you have never used a PivotTable before, you can learn more in Use multiple tables to create a PivotTable.
Related articles
Feedback
Coming soon: Throughout 2024 we will be phasing out GitHub Issues as the feedback mechanism for content and replacing it with a new feedback system. For more information see: https://aka.ms/ContentUserFeedback.
Submit and view feedback for