Microsoft Sentinel
A scalable, cloud-native solution for security information event management and security orchestration automated response. Previously known as Azure Sentinel.
975 questions
This browser is no longer supported.
Upgrade to Microsoft Edge to take advantage of the latest features, security updates, and technical support.
' cx='32' cy='32' r='32' /%3E%3Ctext x='50%25' y='55%25' dominant-baseline='middle' text-anchor='middle' fill='%23FFF' %3EPC%3C/text%3E%3C/svg%3E)
I have connected successfully AWS Cloudwatch Logs and it is showing under Threat Management-Workgroups in Sentinel now. So i would like some help as to what kind of query i can run in sentinel to retrieve any security threats in my AWS environment.
My AWS Environment is running just 1 EC2 instance.
Also, in Workbooks it shows :
Are these the only two activities which Sentinel shows for AWS Cloudwatch or there can be many more.
Thanks
' cx='32' cy='32' r='32' /%3E%3Ctext x='50%25' y='55%25' dominant-baseline='middle' text-anchor='middle' fill='%23FFF' %3ESS%3C/text%3E%3C/svg%3E)
At present we provide two workbook templates for AWS logs . Currently these are the only two activity templates provided natively from Microsoft Side. But You can use these as a primer and create your own workbook as per your needs.
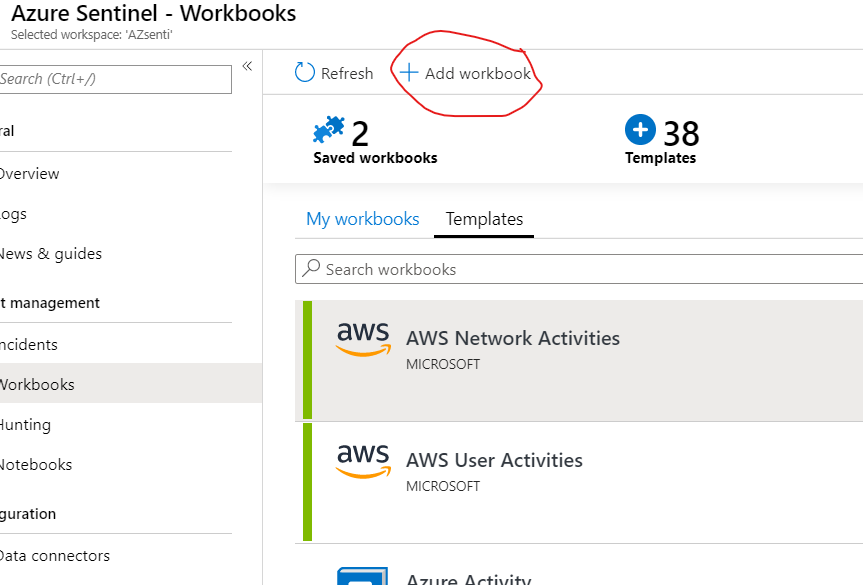
You can customize these as per your needs and create a separate workbook with the data that you would like to see. The two are provided as templates. As you have already setup log analytics workspaces You can click go to the Sentinel workspace where you have connected the AWS cloudTrail/Cloudwatch logs . In the workbook section you can click on Add workbook.
In the New workbook section , please click the directory icon as shown below. This opens a sidebar on the right showing existing shared reports.
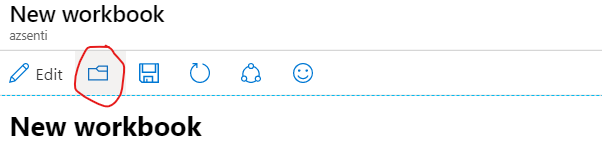
You can select the existing shared report and then use the report to edit as per your needs.
As you do not have anything other than a EC2 VM , there are limited operations which you may be able to use an also you may need to know the parameters and values which are defined in AWS events, using which you would make your query . Every frame is actually a visualization which, in background is generated by some kusto query running over the data collected from AWS.
For example in Azure Cloud , we may call an event parameter SignInUser for any logged in User and AWS may call it LogonUserID , So you would have to know the parameter to run the exact query.
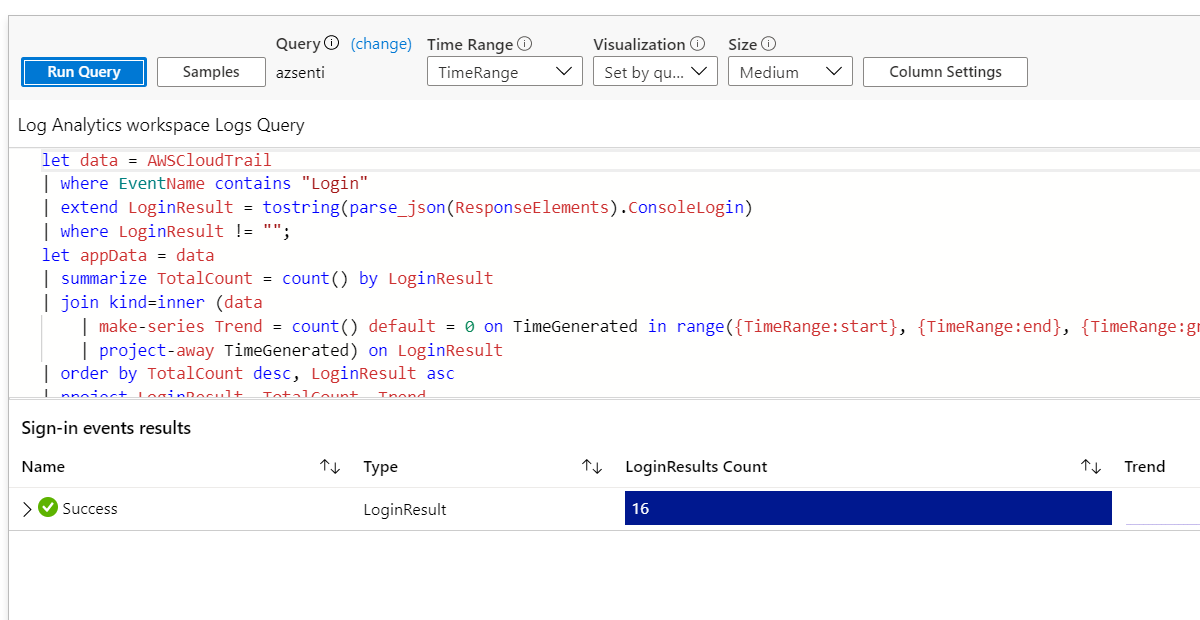
The following Kusto query is seen. The Azure log analytics workspace and Azure monitor system use Kusto query Language in which these queries are written . You can go through the Kusto documentation or Microsoft Learn basic course on how to analyze infrastructure using Azure Monitor Logs.
let data = AWSCloudTrail
| where EventName contains "Login"
| extend LoginResult = tostring(parse_json(ResponseElements).ConsoleLogin)
| where LoginResult != "";
let appData = data
| summarize TotalCount = count() by LoginResult
| join kind=inner (data
    | make-series Trend = count() default = 0 on TimeGenerated in range({TimeRange:start}, {TimeRange:end}, {TimeRange:grain}) by LoginResult
    | project-away TimeGenerated) on LoginResult
| order by TotalCount desc, LoginResult asc
| project LoginResult, TotalCount, Trend
| serialize Id = row_number();
data
| summarize TotalCount = count() by EventName , LoginResult
| join kind=inner (data
    | make-series Trend = count() default = 0 on TimeGenerated in range({TimeRange:start}, {TimeRange:end}, {TimeRange:grain}) by LoginResult, EventName
    | project-away TimeGenerated) on LoginResult, EventName
| order by TotalCount desc, LoginResult asc
| project LoginResult, EventName, TotalCount, Trend
| serialize Id = row_number(1000000)
| join kind=inner (appData) on LoginResult
| project Id, Name = EventName, Type = 'EventName', ['LoginResults Count'] = TotalCount, Trend, ParentId = Id1
| union (appData
    | project Id, Name = LoginResult, Type = 'LoginResult', ['LoginResults Count'] = TotalCount,  Trend)
| order by ['LoginResults Count'] desc, Name asc
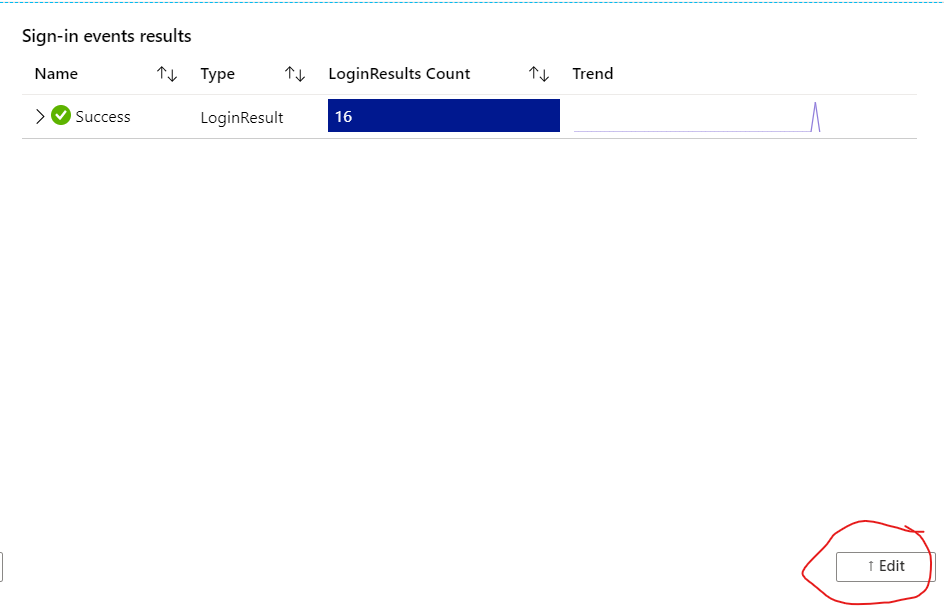
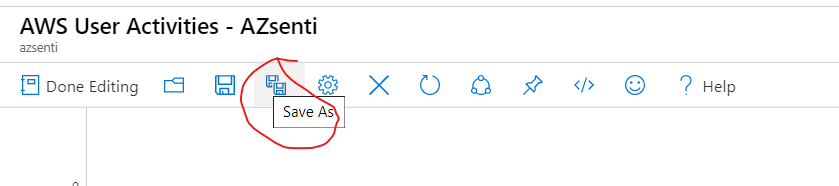
The above query shows all kinds of the events related to sign-in events. Current , we only have successful logons so you only see success however if there are failure event you can find them and analyze them. You can create custom reports and dashboards to view all the required data as per your needs. Once you have made the changes that you need , you can save the workbook .
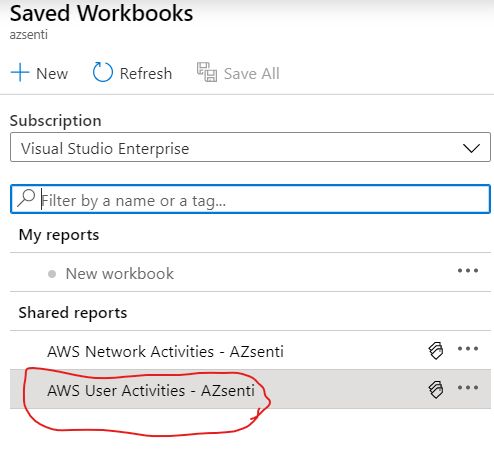
Now you can find this custom report within my reports section on the azure Sentinel workbook and monitor the workbook periodically. Now for your other question that what exactly can you do or how you can search for possible threats, is something which has an extremely broad aspect because it depends on your requirements and the kind of query you can write. In order to write the query , you would need to familiarize yourself with the KQL(Kusto Query Language) and the elements of AWS logs which are ingested in sentinel workspace. Once way to do this can be to get a sample JSON export of different kind of reports data from CloudWatch and CloudTrail and try to find the parameters and key elements . Use these while writing the query in Sentinel . You might think that why would you do it in Sentinel when you can already see the data in AWS? It's because a lot of organizations use both Azure and AWS for different purposes . And the cost of running a complete SIEM solution on-premise is huge due to which we have provided ability to connect most of your systems logs to Sentinel and you can run queries to proactively hunt any possible threats in your environment.
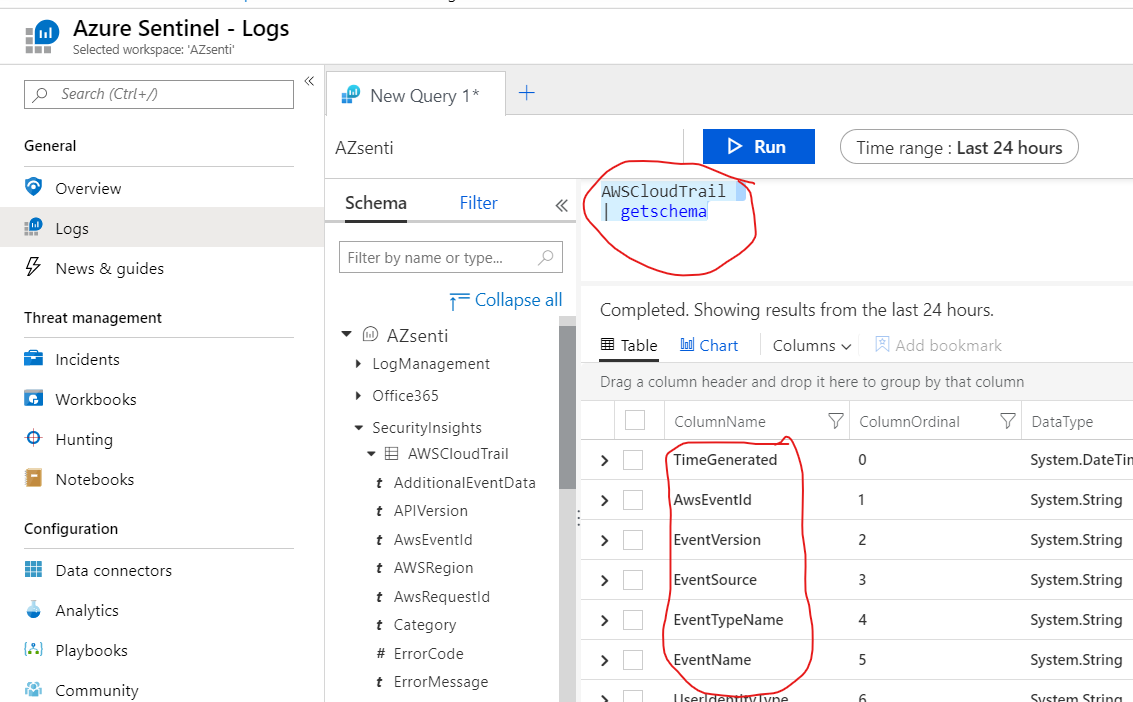
Another way for doing the same is to try to get Schema of the existing CloudTrail table from the SecurityInsights Logs as shown below. This will give you the list of possible elements to use while designing the queries. In addition to this I would suggest to check Cloud Trail Log Event Reference to get values of more elements which can be used while creating queries. The important thing to consider is that the names of elements in AWS log reference wont be same as what you will see in CloudTrail Schema below. For example eventTime on AWS side is recorded as TimeGenerated in the ingested Sentinel CloudTrail Logs
As for the Threat hunting and Exploration queries , I would suggest you to go through Github repo for Azure Sentinel . Since you have just one VM in your AWS account , you may not see a variety of events. Try generating some failure events . Restrict the access to VM from a specific region(say US) and then try to access the VM from any other region except that . This will generate different kinds of logs which you will be able to ingest and play with using the above details. I understand its not exactly what you asked but this surely will give a pointer to anyone who is looking to explore Sentinel for analyzing AWS Cloud logs.
In adition to the above , I would encourage you to check the article by Ashiwin Patil on Microsoft Techcommunity which details one scenario on how to do threat hunting using AWS logs.
Hope this helps. Should you have any further queries , please feel free to ask in the comment . If the information provided in this post helps you , please mark this as answer or vote as helpful so that the relevancy of this post increases and the any other members of the community can find it easily.
Thank you.