VB
An object-oriented programming language developed by Microsoft that is implemented on the .NET Framework. Previously known as Visual Basic .NET.
2,568 questions
This browser is no longer supported.
Upgrade to Microsoft Edge to take advantage of the latest features, security updates, and technical support.
' cx='32' cy='32' r='32' /%3E%3Ctext x='50%25' y='55%25' dominant-baseline='middle' text-anchor='middle' fill='%23FFF' %3EL%3C/text%3E%3C/svg%3E)
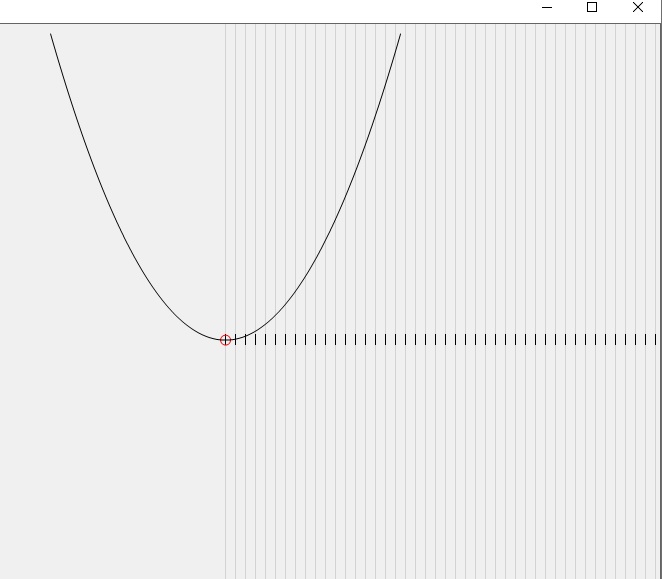
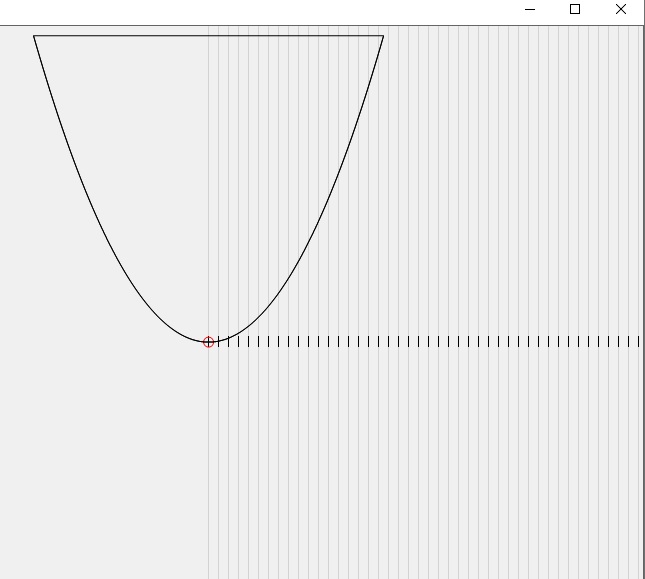
I must not have a full understanding of how to work with some of the graphic functions and need your help. I have included my code with 3 pics. Pic 1 is when I plot the portion of the graph I am working with, pic 2 is the successful plotting of the parabola pic 3 shows the problem. When I click on the first button it displays the graph paper which works fine. Then when I click on the graph 1 button it plots out the parabola which also works fine. However if I click the graph 1 button again it adds a line connecting the 2 points of the parabola which I have no idea where this extra line is coming from. If someone can help me I would really appreciate it.

 ``
``
Uses a form, 3 buttons and a picturebox
Imports System.Drawing.Drawing2D

Public Class Form4
    Private bmp As Bitmap = Nothing
    Private gPath As New GraphicsPath()
    Dim scaleX As Single = 1
    Dim scaleY As Single = 1
    Dim magnifiery As Integer
    Dim g As Graphics
    Private _d As Double = 0
    Private Sub Button3_Click(sender As Object, e As EventArgs) Handles Button3.Click
        PlotGraphPaper(_d)
    End Sub

    Private Sub PlotGraphPaper(ByVal d As Double)
        Dim t, dumX, dumY As Single
        Dim i As Integer = 0
        dumX = CSng(ClientSize.Width / 2)
        dumY = CSng(ClientSize.Height / 2)
        bmp = New Bitmap(Me.ClientSize.Width, Me.ClientSize.Height)
        PictureBox1.Width = bmp.Width
        PictureBox1.Height = bmp.Height
        Using g As Graphics = Graphics.FromImage(bmp)
            g.Transform = New Matrix(1, 0, 0, 1, CSng(ClientSize.Width / 2), CSng(ClientSize.Height / 2))
            g.ScaleTransform(scaleX, scaleY)
            t = CInt((dumX / 40) - 1)
            While i <= 23 * 40 '< bmp.Width / 2
                g.DrawLine(Pens.LightGray, New Point(i, CInt(-bmp.Height / 2)), New Point(i, CInt(bmp.Height / 2)))
                g.DrawLine(Pens.Black, New Point(i, 5), New Point(i, -5))
                i = i + CInt(t)
            End While
            g.SmoothingMode = SmoothingMode.AntiAlias
            g.DrawPath(Pens.Black, gPath)
            g.DrawEllipse(Pens.Red, 0 - 5, 0 - 5, 10, 10)
            PictureBox1.Image = bmp
        End Using
    End Sub
    Private Sub Button1_Click(sender As Object, e As EventArgs) Handles Button1.Click
        Dim pts As New List(Of PointF)()
        Dim x As Integer
        Dim y As Single
        For x = -175 To 175
            y = -CSng((x ^ 2) / 100)
            pts.Add(New PointF(x, y))
        Next
        gPath.AddLines(pts.ToArray())
        Using g As Graphics = Graphics.FromImage(bmp)
            g.Transform = New Matrix(1, 0, 0, 1, CSng(ClientSize.Width / 2), CSng(ClientSize.Height / 2))
            g.ScaleTransform(scaleX, scaleY)
            g.SmoothingMode = SmoothingMode.AntiAlias
            g.DrawPath(Pens.Black, gPath)
            PictureBox1.Image = bmp
        End Using
    End Sub
End Class
Thanks
Les

Move gPath to Button_Click, or call gPath.Reset before adding lines. Otherwise, your lines are considered a continuation of the previous path.
If you want to keep all of the paths, then probably you should define an array or list of GraphicsPath.
Hi Viorel-1
That reset solved my issue!! I did not know that it was a continuation of the previous path. Listen when you suggest an array or list of graphicspath do you mean just make several different array lists??
Thanks so much for your help
Les
If you want to draw many different curves and keep the drawn paths, then define something like a List(Of GraphicsPath). Create a GraphicsPath object for each new curve and add it to this list.
Thank you once again Viorel I will try that
Les