Not Monitored
Tag not monitored by Microsoft.
35,882 questions
This browser is no longer supported.
Upgrade to Microsoft Edge to take advantage of the latest features, security updates, and technical support.
' cx='32' cy='32' r='32' /%3E%3Ctext x='50%25' y='55%25' dominant-baseline='middle' text-anchor='middle' fill='%23FFF' %3EJJ%3C/text%3E%3C/svg%3E)
I want to build 3 charts and show them inside my SharePoint online modern page, the charts are as follow:-
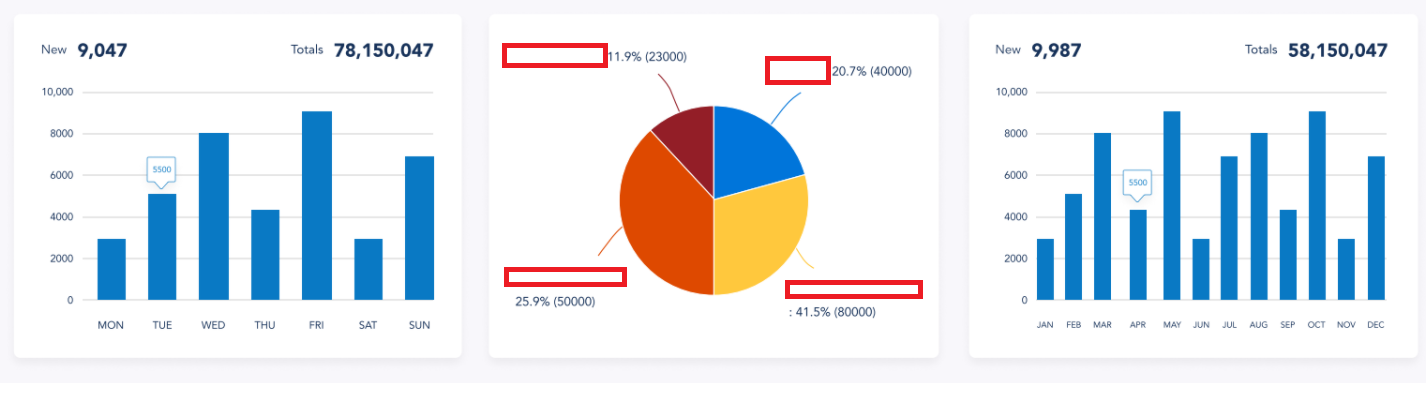
1) First chart is to group the items from a single SharePoint list by Created date, and show the total number of items based on the day of the week (Mon till Sun).
2) Second chart is to show the total number of items from 4 different lists and show the percentage inside a pie chart
3) Third chart is to group the items from a single SharePoint list by Created date, and show the total number of items, based on the month from the first month of the year till current month.
So how i can build such charts and show them inside modern SharePoint page? can i use the modern Quick charts web part, Power App or Power BI?
Thanks
' cx='32' cy='32' r='32' /%3E%3Ctext x='50%25' y='55%25' dominant-baseline='middle' text-anchor='middle' fill='%23FFF' %3EED%3C/text%3E%3C/svg%3E)
You could use Power BI to generate reports you want. Then you could show Power BI reports in the modern page by using Power BI web part.
Power BI is currently not supported in the Q&A forum.
Please start a new discussion via the Power BI Community so that you can get dedicated support on this issue.
Thank you for your understanding.
If the answer is helpful, please click "Accept Answer" and kindly upvote it. If you have extra questions about this answer, please click "Comment".
Note: Please follow the steps in our documentation to enable e-mail notifications if you want to receive the related email notification for this thread.
@Emily Du-MSFT so i can not achieve these type of charts using SharePoint built-in quick charts web part?
Yes.