Whatever happened to the Virtual Cube?
I got asked a very odd question today - "How do you use virtual cubes in Analaysis Services 2005?". I was momentarily speechless (a rare thing for those that know me!). This got me to thinking that there must be quite a few installations of the previous version analysis services 2000 (AS2000) out there run by IT professionals who may have had a look at the current version and gone wibble wibble.
In AS2000 each database comprised a set of dimensions and cubes with each cube centred around a fact table. Suppose we have two fact tables reseller sales and internet sales. Each of these has different dimensions related to it for example resellers sales has a foreign key to the reseller dimension which is not appropriate for intenret sales. In AS2000 you could do two things:
- Create a view in SQL to union the two fact tables. You would need to ensure the resulting view could be inner joined to all the releavnt dimensions or data would be lost when the cube was built as AS 2000 uses inner joins to get data.
- Build a cube based on each fact table and then build a virtual cube over the two cubes and bring in all of the dimensiosn and measures from both. You would then have to write calculated members to combine the measures and possibly hide the source measures.
This worked but was tricky to set up particularly if the two fact tables were aggregated at different levels. For example think of sales v budgets. A sale would have the day of the sale where targets might only be set at the quarter level so you need to aggregate daily sales to the quarter level before comparing them to the budget to determine variance.
SSAS changed all that, possibly a copy of Ralph Kimball's Data Warehouse Lifecycle Toolkit materialised though a wormhole in Redmond, opened at page 271, and somebody thought that'll do nicely and so now multiple fact tables are combined in a single cube where each fact table becomes a measure group as you can see from the screengrab below. The orange arrows shows where the date in reseller sales is at the level of date(day) whereas the sales targets are only at the level of quarter.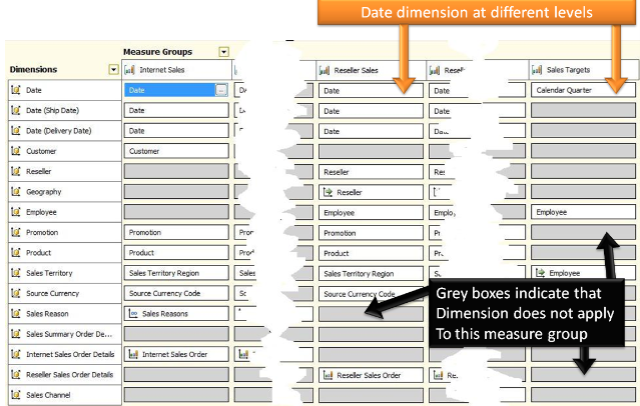
So there are only 2 cubes in the adventure works sample and one of those is for mining whereas there were half a dozen in the old and less complicated Northwind sample in 2000. Of course this means that there are tons of attributes and measures in an analysis services 2005 so the danger here is that the user gets overwhelmed wiht all the stuff in the cube where before a cube was more tightly focused on a particular function.
To reslove this we can use perspectives and security to direct the user to their usefulk stuff and we'll look at that next.
Technorati tags: bi, business intelligence, OLAP, analysis Services