Tracing with Storport in Windows 2012 and Windows 8 with KB2819476 hotfix
Welcome back to the CORE Team Blog. Paul Reynolds here. I would like to let everyone know about changes on how to capture Storport traces in Windows Server 2012 and Windows 8.
===
IMPORTANT: this blog has been superseded by https://blogs.technet.microsoft.com/askcore/2014/08/19/deciphering-storport-traces-101/
===
NOTE: The information below is based on having hotfix KB2819476 installed (part of the April 2013 cumulative update for Windows 8 and Windows 2012). If you do not have this hotfix installed, see the previously written blog:
Tracing with Storport in Windows 2012 and Windows 8 without KB2819476 hotfix
https://blogs.technet.com/b/askcore/archive/2013/01/12/tracing-with-storport-in-windows-2012-and-windows-8-without-kb2819476-hotfix.aspx
We DO recommend installing the hotfix as it enhances the ability to take Storport traces in Windows 8 and Windows 2012. Please note that KB2819476 is already in Windows Server 2012 R2 and Windows 8.1.
Previously, Bob Golding wrote a blog on how to do Storport Tracing in Windows 2008 and Windows 2008 R2. If you have Windows 2008 or 2008 R2 continue to use that blog for your Storport traces.
TRACE GATHERING STEPS
UPDATE 01-04-17: I would like to suggest another approach to capturing Storport traces in Windows (2008 R2 SP1 and up) which is simpler and more elegant - a batch file:
@echo off
ECHO These commands will enable tracing:
@echo on
logman create trace "storport" -ow -o c:\perflogs\storport.etl -p "Microsoft-Windows-StorPort" 0xffffffffffffffff 0xff -nb 16 16 -bs 1024 -mode Circular -f bincirc -max 4096 -ets
@echo off
echo
ECHO Reproduce your issue and enter any key to stop tracing
@echo on
pause
logman stop "storport" -ets
@echo off
echo Tracing has been captured and saved successfully at c:\perflogs\storport.etl
pause
This creates a circular 4GB Storport trace. You can edit it and create event tasks in the System or Application Event Logs to stop it so it is handy for troubleshooting. This has proven to be a much better way to create, start, and stop the Storport traces and I recommend you use this approach instead. It does not have filtering, but I no longer recommend using filtering in Storport traces as it can lead to misleading results and we now have tools (PowerBI, etc.) in Excel that can handle millions of rows of data.
END UPDATE 01-07-16
The process to capture a Storport trace is similar (though not identical) to the way we do it with Windows 2008 and Windows 2008 R2 (see Bob Golding’s blog for more detail). For those already familiar with the process, the main change is:
· Instead of choosing IOPERNOTIFICATION, a new choice called IO_PERMORMANCE is picked
For those not familiar with the process, here is an overview of how to start a Storport trace. (Most of the information is from Bob’s original blog)
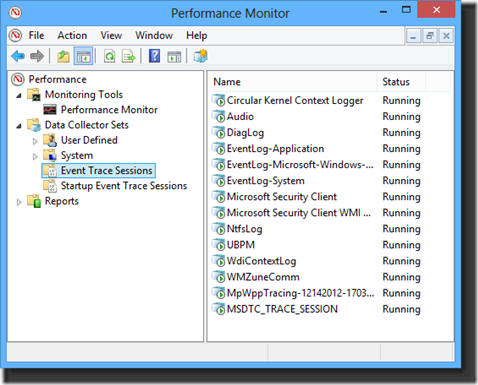
1. Hit the Windows button and type Perfmon.exe, then press enter to start performance monitor.
2. Expand “Data Collector Sets” and “Event Trace Sessions”
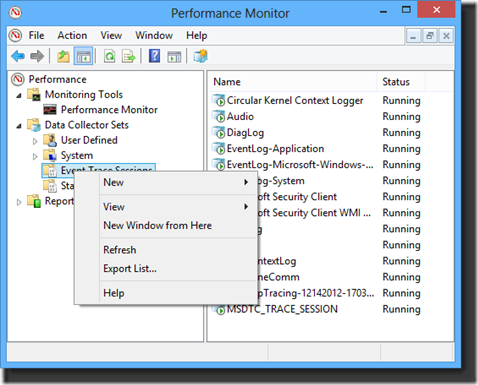
3. Right-Click on “Event Trace Sessions”
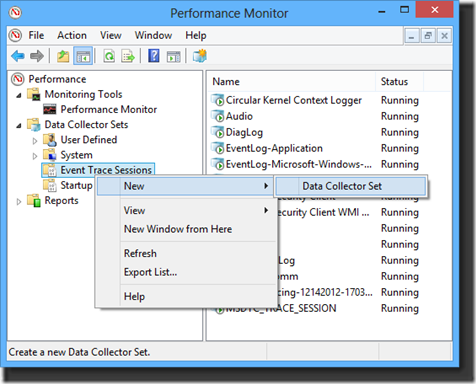
4. Select “New, Data Collector Set”
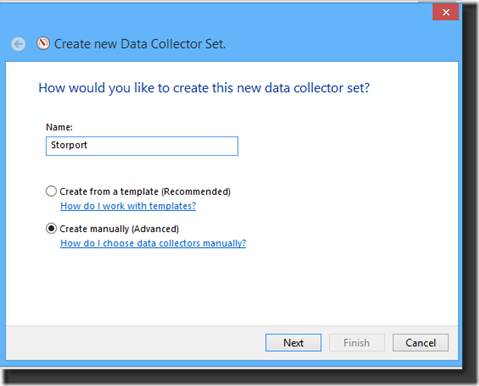
5. The following dialogue will appear:
Give the new data collector set a name in the dialogue box. In this example I called it “Storport”.
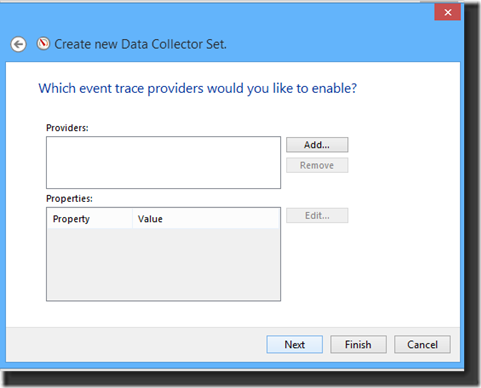
6. Choose the “Create manually (Advanced) option and then click Next to see the following dialogue:
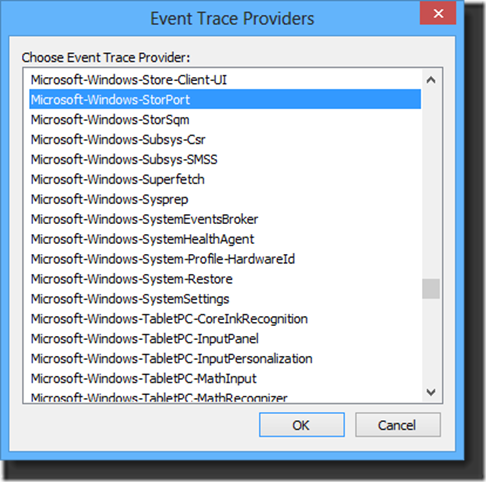
7. Click Add on the dialogue box above and the following list of providers will appear.
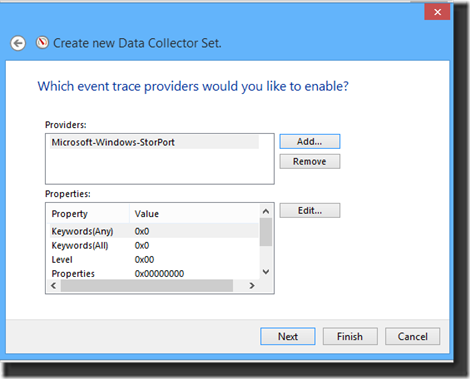
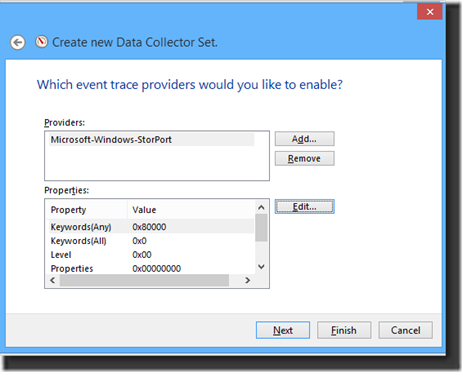
8. Select “Microsoft-Windows-Storport” and click OK. You should now see the following screen:
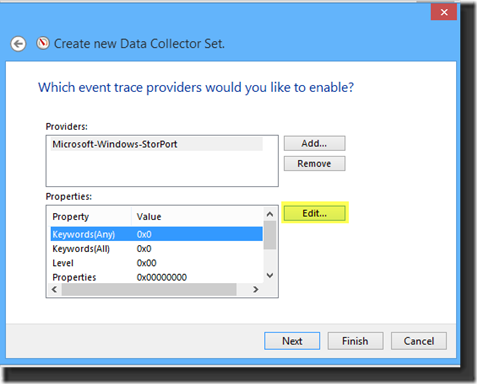
9. Select “Keywords (Any)” then click Edit.
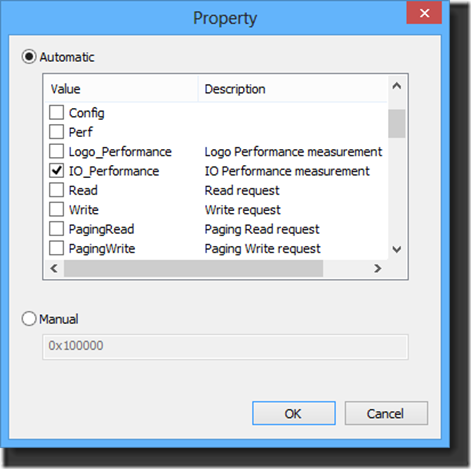
10. Check the box for IO_Performance, and then click OK:
11. You should see the following screen:
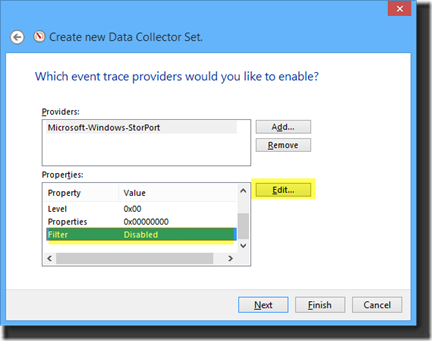
12. At this point you can choose a filter to use for the Storport trace. This is useful for a long-running trace where you want to capture Storport data above a certain threshold.
Select Filter, then Edit:
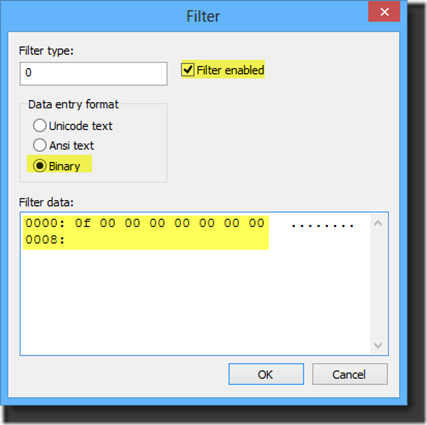
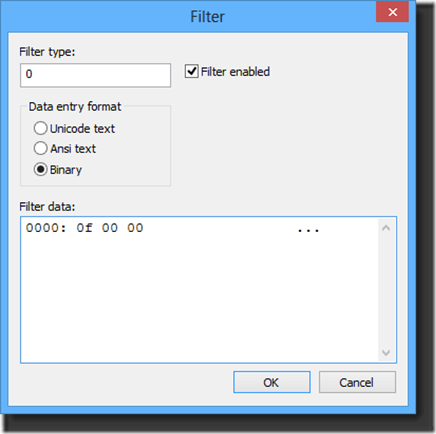
This is where we enter our threshold. Anything equal to or greater than this value will be logged in the trace. If you leave the filter disabled it will create more data but will cause averages for request duration values in the Storport trace to be more in agreement to values obtained for physical disk sec/transfer from a Performance Monitor trace.
Select “Filter Enabled”, choose “Binary”, and in the “Filter Data” field enter the threshold in 100ths of nanoseconds (number of milliseconds X 10,000). This must be entered in little endian format. Refer to the table below for sample values:
Decimal |
Hexadecimal | Binary (little endian) |
| 1ms (10,000) | 2710 | 10 27 00 00 00 00 00 00 |
| 5ms (50,000) | C350 | 50 C3 00 00 00 00 00 00 |
| 10ms (100,000) | 186A0 | A0 86 01 00 00 00 00 00 |
| 15ms (150,000) | 249F0 | F0 49 02 00 00 00 00 00 |
Note: the “Filter type” value will always remain 0 as in the example above.
Warning: the whole data line needs to be filled in when entering a threshold. For demonstration purposes, here is how to do it the WRONG WAY:
Filter values have to be reset after each successful run of a Storport trace. It DOES NOT remember the previous values used.
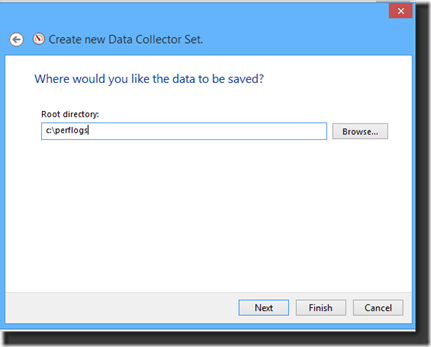
13. Click next and choose a root directory for the trace. In this example I use C:\perflogs:
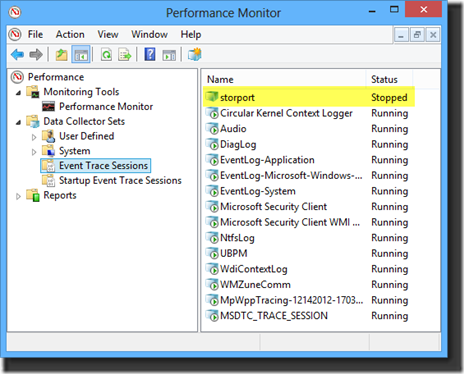
14. Click finish. You should see a new Event Trace Session that is stopped. In this example it is called Storport.
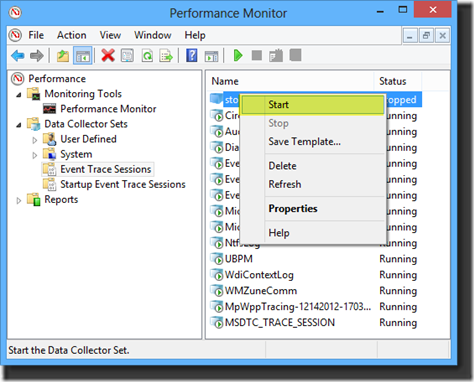
15. Right-click the new Event Trace Session and click Start to start it:
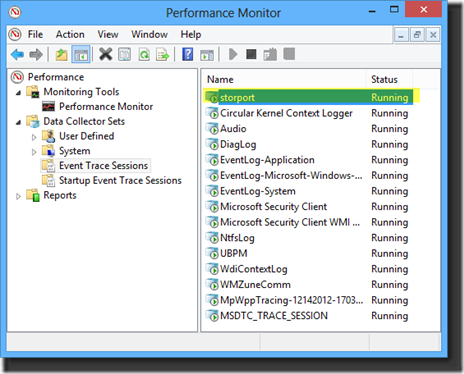
16. You should now see your new Event Trace Session started:
17. After you are done collecting data, right-click the running Storport trace and select “Stop”.
DECIPHERING TRACE DATA
Now that we have a Storport trace, let’s look at the data it contains. A simple way to see the data is via Event Viewer:
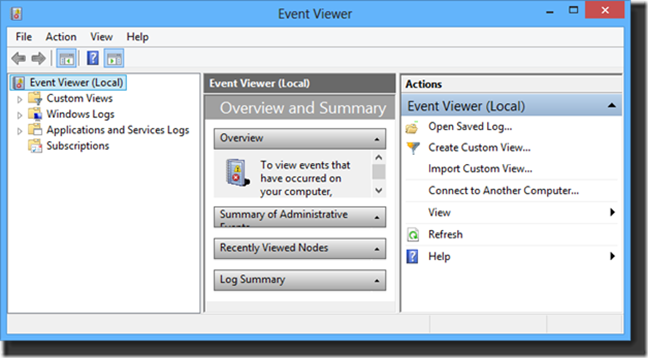
1. Hit the Windows key, type “eventvwr.exe” and hit the enter key. The Event Viewer utility will start:
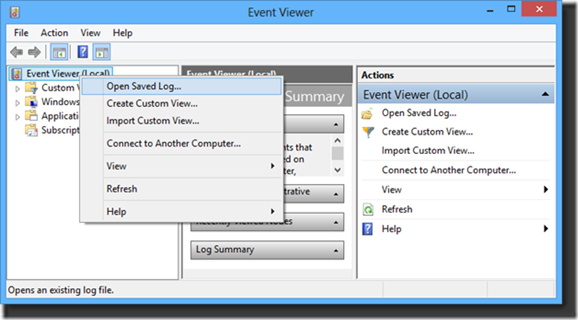
2. Right-Click on Event Viewer (local) and click on “Open Saved Log”:
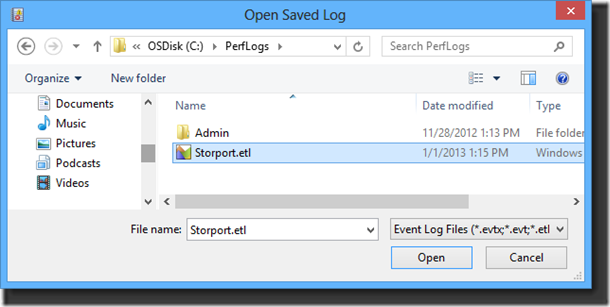
3. Choose the directory the Storport trace was saved to, highlight the ETL files and click Open. In this example, we chose c:\perflogs.
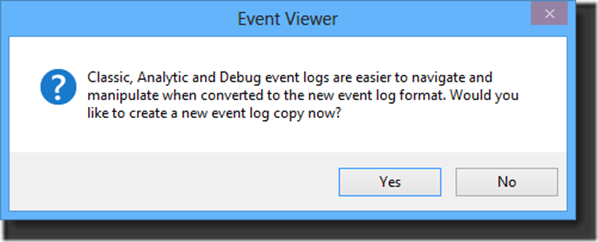
4. After clicking “Open” a dialogue box will appear asking to create a new event log copy. Click “Yes”.
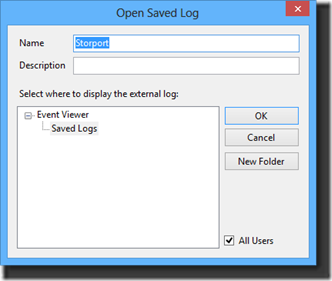
5. You will see the following screen. We left the settings as the default and clicked “OK”.
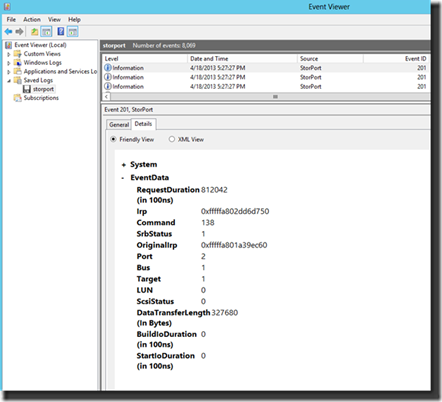
6. After clicking OK you will see Event ID 201 messages:
7. Let’s look at the detail of the data:
Request Duration: how long the (firmware/drivers/hardware/storage network/SAN) took to process a I/O request packet in 100ns. To convert to milliseconds, divide this number by 10,000.
Command: decimal form of SCSI command. If you wish to look up the SCSI command (convert decimal value to hex first) see https://en.wikipedia.org/wiki/SCSI_command.
SrbStatus: Status Request Block status returned from the adapter (see srb.h and scsi.h in the Microsoft WDK)
Port: This is the adapter port number (e.g. RaidPort1, etc.)
Bus: This is the Bus number
Target: Target ID of the LUN exposed to the Operating System
LUN: Logical Unit Number of the physical storage
ScsiStatus: decimal form of SCSI Status Code. If you wish to look up the SCSI Status Code (convert decimal value to hex first) see https://en.wikipedia.org/wiki/SCSI_Status_Code
DataTransferLength: the length of the data transfer in Bytes
BuildIODuration – length of time the miniport has spent in the build I/O function (usually very small, measured in 100ths of nanoseconds )
StartIODuration – length of time the miniport has spent in the start I/O function (usually very small, measured in 100ths of nanoseconds)
CLOSING THOUGHTS
When troubleshooting disk performance issues, Storport traces capture data from the last layer of software in Windows that an I/O Request Packet (IRP) will pass through before being handed off to hardware. It is an excellent tool for checking if slow disk performance is hardware related.
In a next blog post I will show a way to look at Storport data via Excel Spreadsheets with Pivot Tables and Pivot Charts. You can look at millions of rows of data if you use the free PowerPivot add-on available with Office 2013.
Paul Reynolds
Support Escalation Engineer
Windows Core Support Team
