BizTalk Health Monitor v4.0 released!
Hello everyone! Thanks to your continuous feedback and suggestions which helped us shipping another version of BHM with exciting new updates. One of the commonly requested feature from our customers was to add “real-time” monitoring capabilities in BHM in addition to the existing Health Check feature. A monitoring capability that lets you monitor critical components of a BizTalk group like receive locations, send ports, orchestrations, host instances, queues, and BizTalk databases sizes. BHMv4 addresses that feedback and provides a very easy and quick way to enable such monitoring by reusing the health check framework of BHM and its flexible profiles feature. In addition to the new features, BHMv4 will also be compatible with newly released BizTalk Server 2016. You can download BHMv4 from Microsoft Download Center. Please see the included Readme.htm for installation information.
We would love to hear your feedback about this new version, so please reach out to us either via comment section or drop us an email.
Following is the quick peek in to the New Features of BHMv4.
- Monitoring Profiles with UI based configuration (Old “Monitoring Profile” is now renamed with “Health Check Profile”)
- Schedule your report collection with a Windows service (Windows Task option is still available)
- New “Trace Log” node to quickly display the log of an analyze. Build to show insights in report collection failures.
- Compatible with and Updated for BizTalk Server 2016
- Better user experience by allowing Queries and Rules lists to be displayed in full screen mode.
- Improved repositories auto-update feature
- More robust. Fixed crash issue on MMC termination.
Before we proceed further let’s understand the difference between “Monitoring Profile” and “Health Check Profile” with their use cases.
Prior to BHMv4, we had only one type of profile known as “Monitoring Profile”. With BHMv4 we are renaming it with “Health Check Profile” as we are introducing a new concept for “Monitoring Profile”. The new Monitoring Profile is auto-populated with the common set of custom rules which can be further customized quickly to suite your requirements. You can schedule the analyze of this monitoring profile and send the output to either the event logs or in an email.
Think of Health Check Profile as a comprehensive check-up of your BizTalk Server Group which you would like to perform in larger interval, like every morning or every mid-night, may be weekly. Monitoring Profile on the other hand is set of few very specific checks that you want to auto-mate in regular interval, like every 5 minutes or at a very specific time frame. For e.g. let’s say my partner is supposed to send me the delivery order every-day at 10 AM. And I would like to make sure that my Receive Location is enabled during that time. With the monitoring profile, I can configure BHM to check the status of that Receive Location at 9:55 AM and send me an alert if it is disabled.
Following section will give you complete details about “Monitoring Profile”
Monitoring Profile
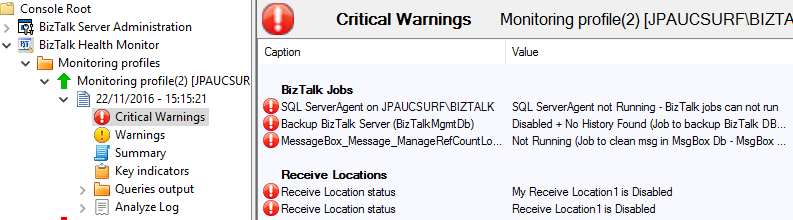
Monitoring profile is in fact a BHM profile but configured specifically to execute a short selection of critical BHM queries/rules and custom rules checking the state of given ports, orchestrations, host instances, queues and BizTalk databases sizes, and raise critical warnings detected in a log.
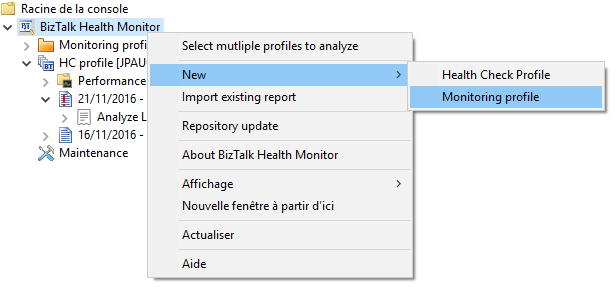
You can create a new Monitoring Profile by right clicking on the BizTalk Health Monitor node and select NewàMonitoring Profile.
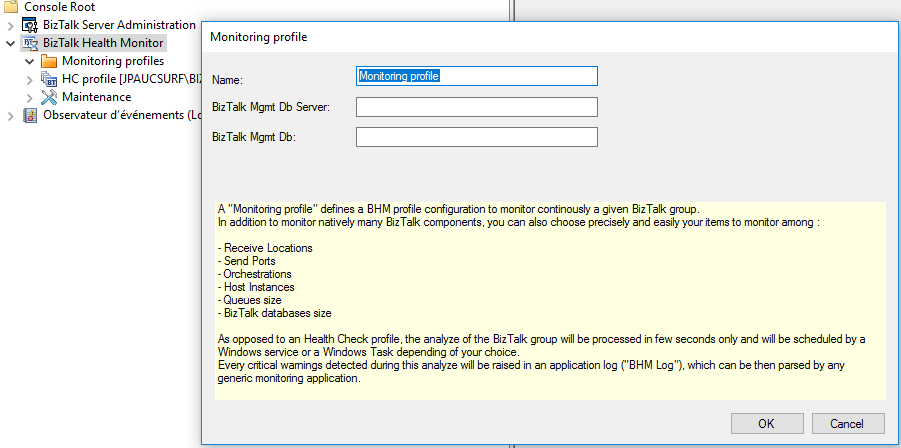
Monitoring Profile Configuration
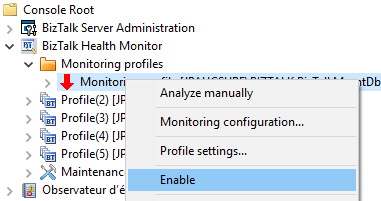
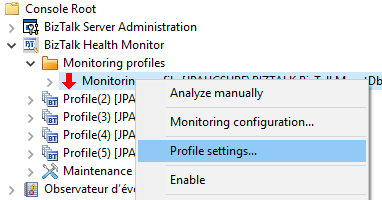
To configure a Monitoring Profile, right click on the newly created Monitoring Profile and select “Monitoring Configuration”
The Options tab of this dialog box allows you to:
- Enable\Disable the Monitoring Profile
- Configure the name of Monitoring Profile
- Schedule\Actions Settings, lets you choose the schedule method, its frequency and types of actions to collect the report
- Log Settings, lets you configure the logs where you would like to record the warnings.
- Email settings, lets you configure the emails alerts
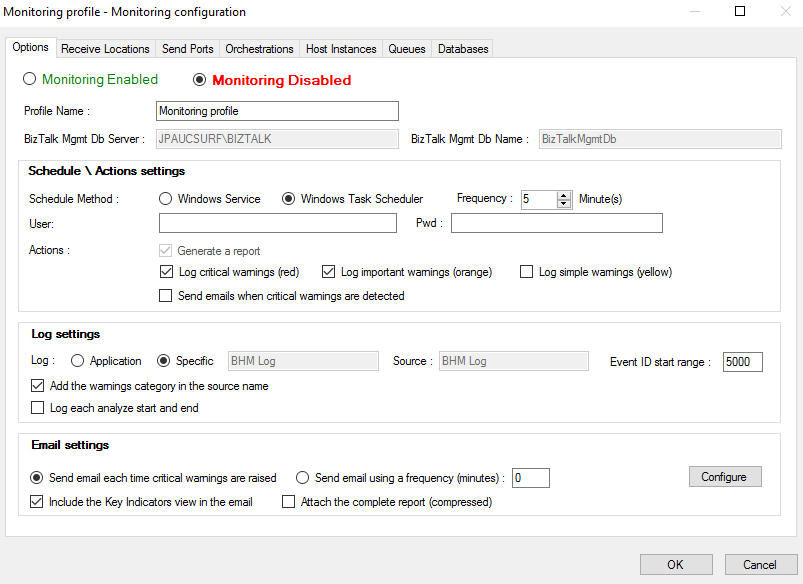
Schedule \ Actions settings: Service or Task
A Monitoring profile can be scheduled either via a Windows Service or a Windows Task. The service or task is automatically created by BHM when you validate the Settings dialog box for the first time. Following is the naming convention: The service name is BizTalk Health Monitor:<profile name>
and The Task name is BizTalk Health Monitor{<profile name>} 
The service or task will be configured to run under a specific account that you must enter in the Settings dialog box.
Important Note : This account will be used to execute the BHM queries so it must be a member of BizTalk Administrator group and SYSADMIN on the SQL instance hosting the BizTalk databases to analyze
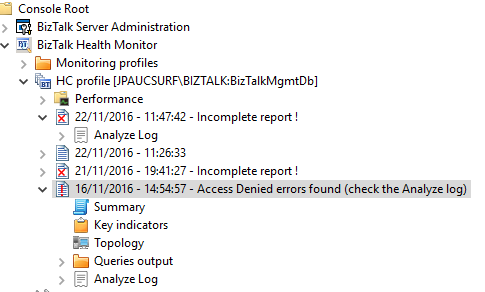
The service or task will execute BHM collector (BHMCollect.exe) based on the frequency you defined in the Settings dialog box. Notice that the service is not doing anything else than spawning periodically the BHM collector. You can at any time disabled or enabled the monitoring profile by selecting the corresponding action in the profile context menu or in the Settings dialog box. Disabling a profile disables in fact the corresponding Windows service or Windows task. Disabled profile will appear in BHM as red and a running one as green:
Note: If you disabled the service or task outside BHM, it will reflect the new state at startup time or on a refresh action.
Generated report by Monitoring Profile
A BHM report will be always generated after the execution of a Monitoring profile (either manually or scheduled) but the corresponding Report node will not contain a Topology node and Performance nodes, as opposed to a Health Check report. It will still contain however the output of the executed queries. A Monitoring profile is not configured to keep an history of generated reports so it will override the existing report; this configuration is done to avoid having a different report generated each time the profile execution is started:
 Warnings and Log
By default, both critical and important warnings (red and orange) detected will be raised to the BHM log but you can configure the profile to raise only simple warnings (yellow); or even keep only the critical warnings to be raised. Note that only the critical warnings will be raised as real errors entries in the BHM log . Emails
You can also decide to send also emails if critical warnings are detected. The email will contain then the list of critical warnings and the list of key indicators of the group health check. Notice that this email send feature was already present in BHM 3.2
BHM Log
A specific BHM log (Event Los) is used by default to log the warnings but you can change it to be the Application one. The warnings are raised under this format:
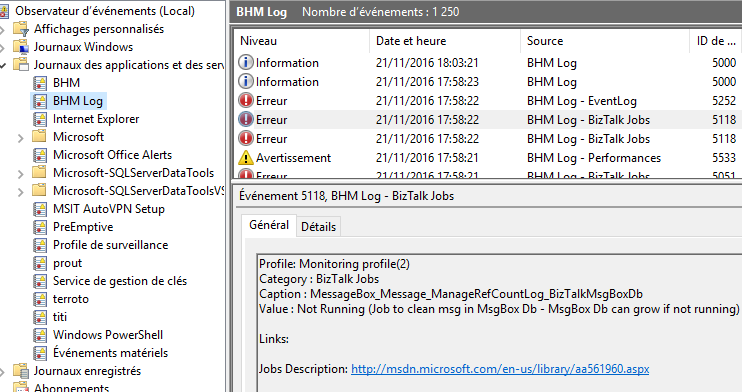
Each category of critical warnings raised by BHM in the log has a unique event ID based on a range start ID (5000 by default) and a unique id of the warning category. By default, the source name of the event entry will be suffixed by the warning category but it can be ignored.
The source of the entries is BHM Log and is suffixed by the warning category so you can see quickly the type of BHM warnings raised without displaying their details. The text of each warning entry contains the name of the originating profile, its category, caption and value as they would appear classically in the BHM warnings node. These details will help you to configure any existing monitoring tool that you are using like SCOM.
Monitoring Selection
Rest of the “Monitoring Configuration” tabs allow you to select/unselect from the pre-populated list of rules for monitoring. These lists are automatically populated when they are first visible. For Receive Ports, Send Ports and Orchestrations all the items are selected by default to be monitored:
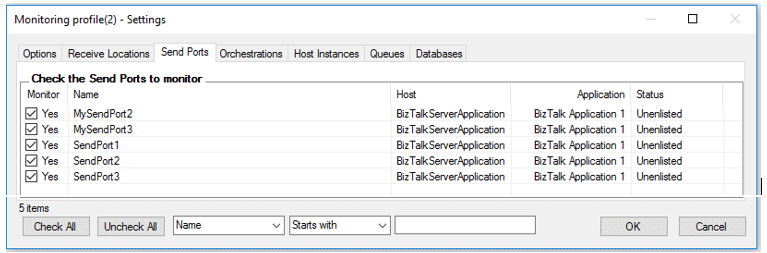
e.g. scenario – Check every 5 minutes and send me an alert when SendPort1 gets disabled.
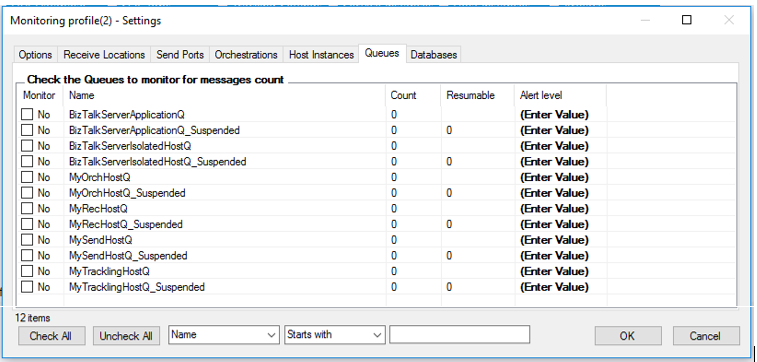
The Queues and Databases list views allow to select the sizes of BizTalk queues and databases you want to monitor:
e.g. scenario – Check every 5 minutes and send me an alert when suspended queue of my application goes beyond 500 messages.
Monitoring of queues and BizTalk databases size is disabled by default and no thresholds are defined. You can configure them as per your need:
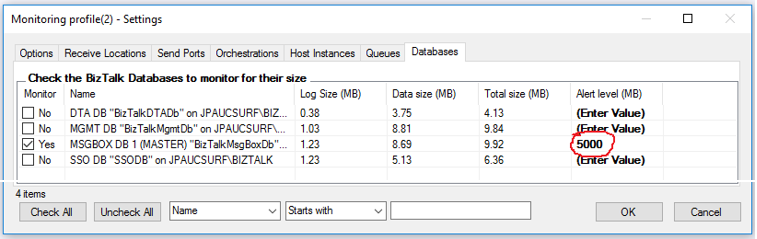
e.g. scenario – Check every 5 minutes and send me an alert when MsgBoxDB size goes beyond 5000 MB.
Each list view has the possibility to sort and filter its items based on different criteria:
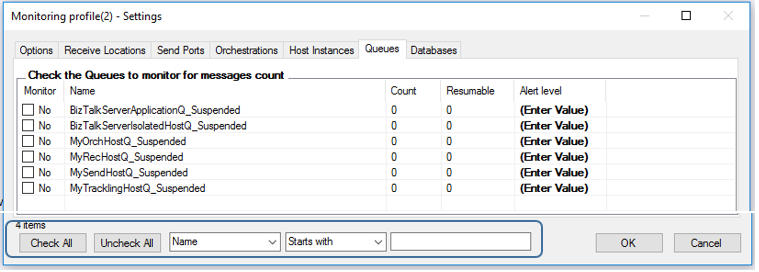
Note: You can maximize the Dialog box to display in full screen mode the list views and have a better visibility of the list items.
Monitoring Profile Settings
You can still display the Profile Settings dialog box for a Monitoring profile which is in fact the standard dialog box already present in previous versions of BHM to change the settings of a profile.
In the Profile settings dialog box, you can see in the Rules tab the custom rules mentioned above and even edit the these rules. It is however recommended to use the Monitoring Configuration dialog box to update automatically these rules, based on your selection.

Report generation and Analyze level
You can also access to all the options which were pre-configured for this monitoring profile, like the single overwrite report generated or the list of selected queries:
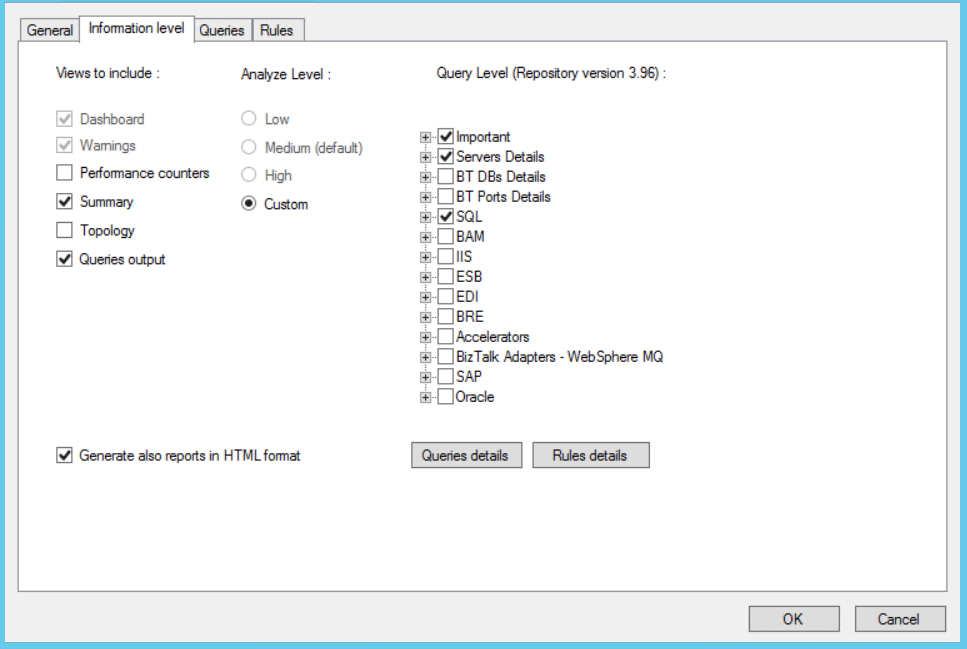
Note : You can now maximize the Profile Settings Dialog box to display in full screen mode the list views and have a better visibility of the queries and rules list items
Warning: This profile Settings dialog box can be used to modify the Monitoring profile as you want. However, please be aware that it was pre-configured with specific default settings to allow maximum performance and not generate overhead when executed frequently (every few minutes), so be careful with your selection of additional queries to be executed under a Monitoring profile. For a more comprehensive report, we recommend using Health Check Profile.
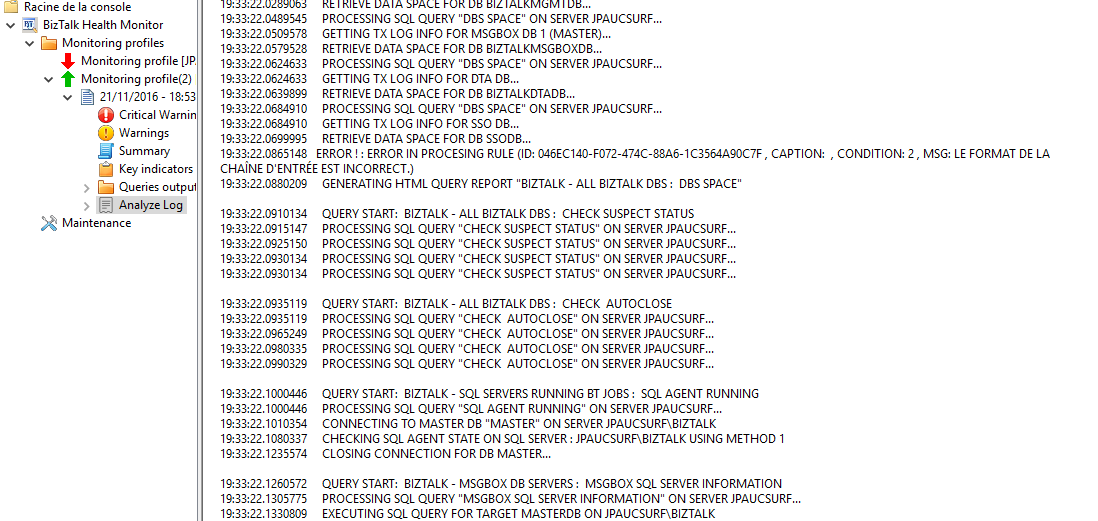
Trace Log
In previous versions of BHM, you had to use the context menu of a BHM report to check the status of the file produced during the execution of the profile. BHM v4 now generates a Trace Log node for each report which allows to immediately display the status of an analyze:
Report Access Denied errors
If during the execution of a profile some queries generated Access Denied errors, BHM will notify you of the present of these errors in the Analyze log: