Adding ASP.NET Tracing to IIS 7.0 Failed Request Tracing
IIS 7.0 Failed Request Tracing (for historical reasons internally we refer to it as FREB, since it used to be called Failed Request Event Buffering, and there are no "good-sounding-decent" acronyms for the new name) is probably the best diagnosing tool that IIS has ever had (that doesn't require Debugging skills), in a simplistic way it exposes all the interesting events that happen during the request processing in a way that allows you to really understand what went wrong with any request. To learn more you can go to https://learn.iis.net/page.aspx/266/troubleshooting-failed-requests-using-tracing-in-iis7/.
What is not immediately obvious is that you can use this tracing capabilities from your ASP.NET applications to output the tracing information in our infrastructure so that your users get a holistic view of the request.
When you are developing in ASP.NET there are typically two Tracing infrastructures you are likely to use, the ASP.NET Page Tracing and the System.Diagnostics Tracing. In recent versions they have been better integrated (attribute writeToDiagnosticsTrace) but still you want to know about both of them.
Today I'll just focus on logging ASP.NET Tracing to FREB, and in a future post I will show how to do it for System.Diagnostics Tracing.
To send the ASP.NET Tracing to FREB you just need to enable ASP.NET tracing, use the ASPNET trace provider and you will get those entries in the FREB log. The following web.config will enable FREB and ASP.NET Tracing. (Note that you need to go to the Default Web Site and Enable Failed Request Filtering so that this rules get executed)
<?xml version="1.0" encoding="UTF-8"?>
<configuration>
<system.web>
<trace enabled="true" pageOutput="false" />
</system.web>
<system.webServer>
<tracing>
<traceFailedRequests>
<add path="*.aspx">
<traceAreas>
<add provider="ASPNET" areas="Infrastructure,Module,Page,AppServices" verbosity="Verbose" />
<add provider="WWW Server" areas="Authentication,Security,Filter,StaticFile,Compression,Cache,RequestNotifications,Module,Rewrite" verbosity="Verbose" />
</traceAreas>
<failureDefinitions statusCodes="100-600" />
</add>
</traceFailedRequests>
</tracing>
</system.webServer>
</configuration>
Now if you have a sample page like the following:
<%@ Page Language="C#" %>
<script runat="server">
void Page_Load() {
Page.Trace.Write("Hello world from my ASP.NET Application");
Page.Trace.Warn("This is a warning from my ASP.NET Application");
}
</script>
<html xmlns="https://www.w3.org/1999/xhtml">
<head runat="server">
<title>Untitled Page</title>
</head>
<body>
<form id="form1" runat="server">
<div>
</div>
</form>
</body>
</html>
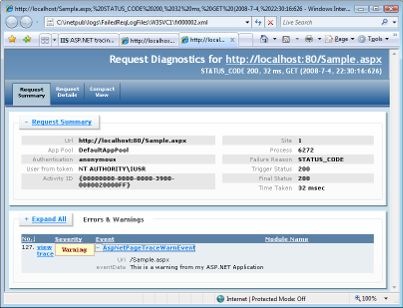
The result is that in \inetpub\logs\FailedReqLogsFiles\ you will get an XML file that includes all the details of the request including the Page Traces from ASP.NET. Note that we provide an XSLT transformation that parses the Xml file and provides a friendly view of it where it shows different views of the trace file. For example below only the warning is shown in the Request Summary view:
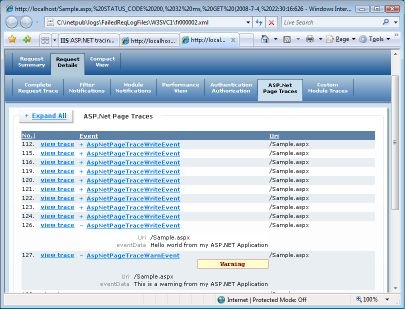
There is also a Request Details view where you can filter by all the ASP.NET Page Traces that includes both of the traces we added in the Page code.