Formatting fields in PowerApps data tables
The Data table control in PowerApps is an easy and quick way to display data in a tabular format on an app created in the platform. It has been released a couple of months ago, and it still has many features coming up over the upcoming versions (listed in the control reference page).
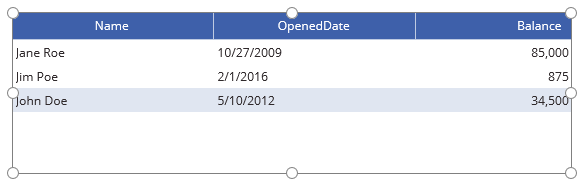
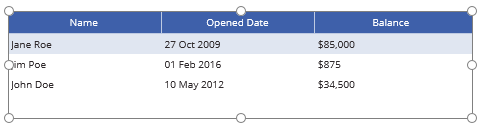
One of the missing features is the ability to choose the formatting of the data that is displayed on the table (as was noted by a question in the PowerApps forum). For example, the image below shows a table with three columns with the (only) way that the data can be formatted at this point:
While the data table control itself cannot do that, we can use the AddColumns function to create "virtual" columns in our data source that look like we want, and then use them in the data table. Notice that the AddColumns function doesn't change the original data source - my SQL table that contains the data will still only have the columns that originally had. Instead, it will return a new data source with new columns added at runtime.
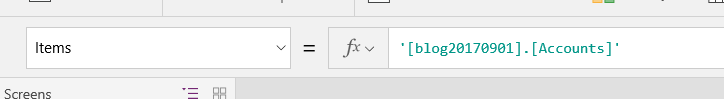
In my example, I want to format both the date and the number in a different way. To do that, select the data table and in the formula bar choose the Item property:
Now replace that formula with one that adds the two formatted columns:
AddColumns( '[blog20170901].[Accounts]', "FormattedOpenedDate", Text(OpenedDate, "dd mmm yyyy"), "FormattedBalance", Text(Balance, "$##,#"))
And nothing happens... And even when we look at the customization table, we still don't see the new columns
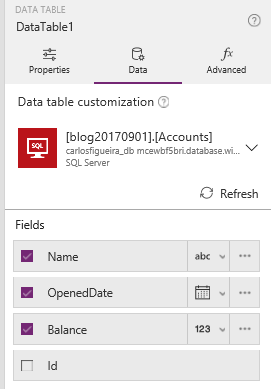
That's a bug in the control that will be fixed in an upcoming release - apparently if you have a connected data source, the customization pane is only showing the original columns.
But there's a way to work around this issue: if you have a disconnected data source (i.e., a local collection), then the new columns do appear in the customization pane. So we can "cache" the data from the original data source in a local collection, and use that local collection as the source of the data table. One way to do that is to, on the OnVisible property of the screen, to load all the data locally:
ClearCollect(localCollection, AddColumns( '[blog20170901].[Accounts]', "FormattedOpenedDate", Text(OpenedDate, "dd mmm yyyy"), "FormattedBalance", Text(Balance, "$##,#")))
Now, if we choose the local collection as the source of the data table, we should see the new columns:
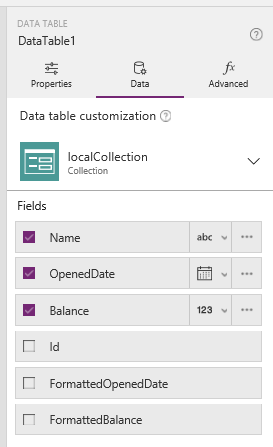
After unchecking the original columns, and checking the formatted ones (and going to the advanced pane to change the title of the columns), we can finally see the formatted data in the data table:
Notice that since the collection displayed in the data table is local, if there are updates to the original data source, you'll need to reload it. If the updates are all made on a screen other than the one that contains the data table, then using the OnVisible property of the screen already solves this problem. If you can modify the data source in the same screen, then you'll need to run the same ClearCollect action to reload the collection.
Wrapping up
This is the first of a series of blog posts that I'll write on how to make some scenarios in PowerApps to work. Some of them are workarounds for existing bugs that will be fixed, some are missing features. For new feature requests (or even to make some existing features easier to use), please do go to the PowerApps Ideas Board and either vote up existing ideas or create new feature requests; that helps the team to prioritize the new features that are constantly being added to the platform. Send us your feedback!