Internet Explorer 9 Developer Tools Deep Dive – Part 3: Debugging JavaScript
This continues a series of posts on the F12 Developer Tools included with Internet Explorer (since version 8) to help you improve your websites with tools to review content, diagnose issues, improve performance, and more:
- Part 1 – Introduction
- Part 2 – Working with HTML and CSS
- Part 3 – Debugging JavaScript
- Part 4 – Profiling JavaScript
- Part 5 – Network Performance and Debugging
If this is your first look at the F12 Tools, I recommend you skim through the introductory post first.
Debugging JavaScript with Internet Explorer
Because using JavaScript to create web applications isn’t without its share of… challenges, the F12 Developer Tools can be very handy.
In this article, you’ll see how features from breakpoints and debugging code, to variable inspection and script formatting can make things easier.
Using the Debugger
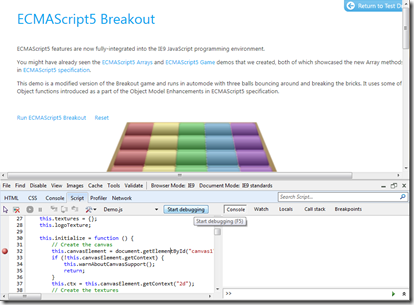
To start debugging, open the Developer Tools (press F12 or choose Tools –> F12 Developer Tools) then select the Script tab and set a breakpoint (F9 or right-click and choose “Insert breakpoint”), then press “Start Debugging”.
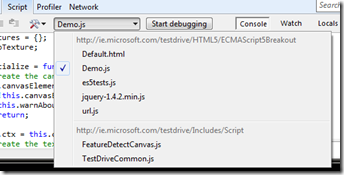
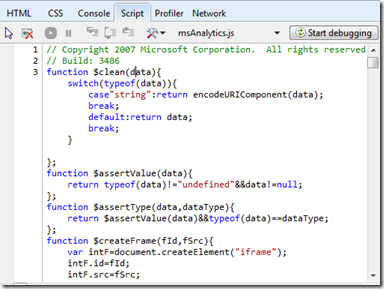
Use the script drop-down list to switch between all of the page’s scripts:
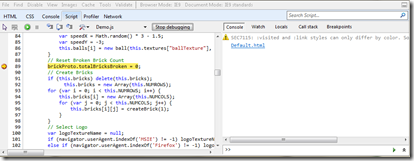
Start debugging, and if the breakpoint (or an error as we’ll see next) is hit, the debugger will pause at the line:
Use the toolbar buttons or access keys to step through code:
The options are (from left to right):
- F5 – Continue – Continue execution
- CTRL+SHIFT+B – Break All – Break on any next statement
- F11 – Step Into – Step forward, including into any functions
- F10 – Step Over – Step forward, without going into any called functions
- SHIFT+F11 – Step Out – Step forward, but out of the current function
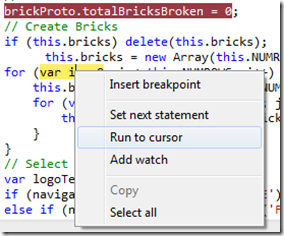
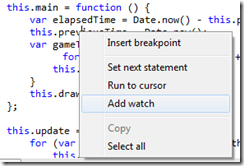
Right-click on the code for more options:
- Set next statement – Makes the target statement execute next, skipping any code between it and the current statement.
- Run to cursor – Executes code until the target statement is reached, including running any code between it and the current statement.
- Add watch – See Working with Variables - Watch and Locals below
Tip: If Internet Explorer reports “not responding”, check to see if the F12 Tools are waiting on a line of code in debugging mode. The F12 Tools’ window detaches in debugging mode and may have snuck under IE’s window while awaiting your input.
Errors
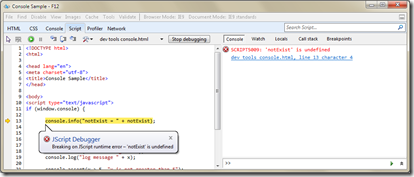
If you run a script with an error (and the F12 Tools running), you’ll see the error highlighted in the Script tab:
The Console (on the right-hand side) will display a list of messages and errors. You can click on the hyperlinks to navigate to the line of code when available. MSDN has a list of built-in error codes (and suggested fixes) for common issues (from security to HTML5). More on the Console in a moment.
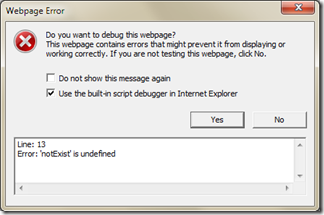
Note that before seeing this, you may be prompted to launch the debugger. Click Yes to launch the debugger (and check “Do not show this message again” to keep it quiet in the future).
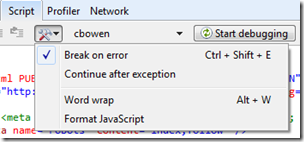
Note that you can enable/disable breaking for errors via the “Break On Error” configuration option (CTRL+SHIFT+E).
Formatting JavaScript
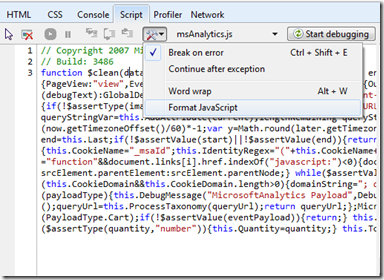
Many times, you’ll use “minified” versions of JavaScript files to reduce download sizes and improve performance. That’s great for optimization… but not so great for readability.
Fortunately, the Configuration  (CTRL+ALT+O) menu has a “Format JavaScript” option:
Same source, just formatted to be easier to read (notice how the line numbers are preserved). Set breakpoints as you wish and enjoy.
Working with the Console
The Console was given its own tab in IE9, but as you’ve seen above, is also available as a pane of the Script tab (in IE8 and later).
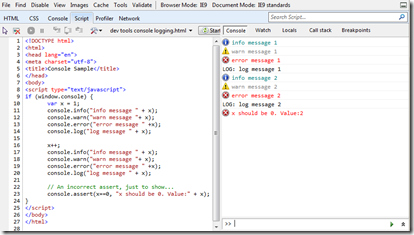
Console displays error messages and also supports diagnostic information via the window.console object. You can use these functions to instrument your scripts to help you detect and trace issues (instead of those jarring alert() calls):
- console.log – General logging
- console.info – Informational message
- console.warn – Warning message
- console.error – Error message
- console.assert – Emit message only if a condition fails
Also:
- console.clear – Clears the console window
- console.dir – Displays details for an object
- console.profile/profileEnd – Start/stop a script profiling session (covered in Part 4 of this series)
You can check existence of window.console if you have script you only want executed when the F12 Tools are running. For example:
- Tip: You don’t need to be debugging for these diagnostic messages to display.
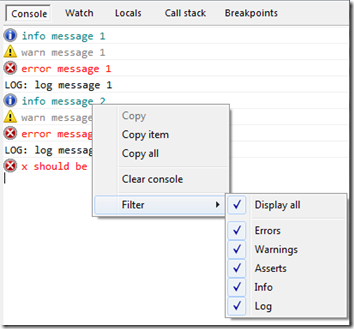
Seeing too many messages, or just want to see certain message types? Right-click in the Console and choose “Filter” option(s):
Executing Script
The textbox at the bottom of the Console supports direct script execution. Enter variable names to see details (via window.console.dir), expressions, or statements.
You’ll see the result in the Console, and browser’s rendering of the page will reflect any effects/changes as well.
- Tip: This is a great way to learn/test commands from JavaScript libraries like jQuery.
- Tip: If you run script that modifies the DOM (e.g. adding elements), the HTML tab won’t show the change (nor let you select it via “Select Element By Click”) until you hit the Refresh
 button - the one in the F12 Tools, not IE’s page refresh.
You can enter a single line, or click the multiline button  (CTRL+ALT+M) to enter multiline scripts.
Working with Variables - Watch and Locals
Because seeing code is only part of the battle, you’ll want to inspect variables as well. When debugging, the Script tab lets you hover over variables to see details.
From simple properties and scalars:
To full object inspection:
The Locals and Watch panes help you track values of variables and objects. Locals is constantly updated to show you values of locally-scoped variables:
Values changed by the latest executed statement are shown in red.
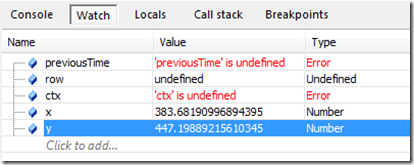
The Watch pane shows only variables and expressions you indicate. You can also add a watch directly in the Watch pane, from an entry in the Locals pane, or by right-clicking on a variable name in debugging mode:
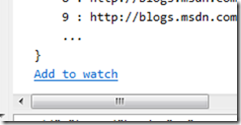
Also note that as you execute script via the Console, variables, jQuery results, and the like offer an “Add to watch” option.
Unlike the Locals pane, Watch retains the same set of items as you step through code. In-scope watch variables will have values displayed, out-of-scope variables are shown as “undefined”:
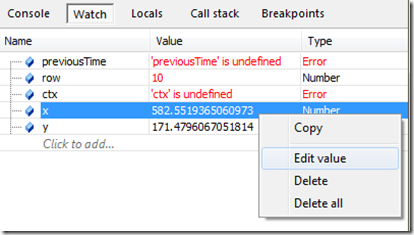
The Watch and Locals panes allow you to edit variables. Double-click the Value cell or right-click and choose “Edit value”:
The Call Stack
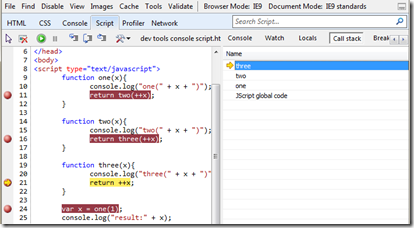
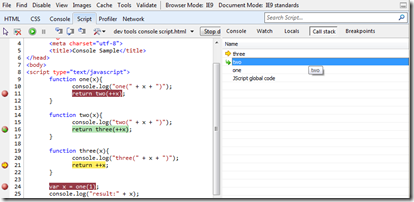
Many times you will be debugging code but wondering just what series of functions led execution to that point. Use the Call Stack pane to see the path of functions:
You can navigate between items on the call stack by double-clicking. The chosen stack item line will be highlighted in green (and as always the current/executing line of code is highlighted in yellow):
Managing Breakpoints
Finally, you can direct the tools to break at certain lines by setting breakpoints. Just select the line in the Script tab and press F9 or right-click and choose “Insert breakpoint”:
You can further control breaking by setting the “Break on error” and “Continue after exception” options:
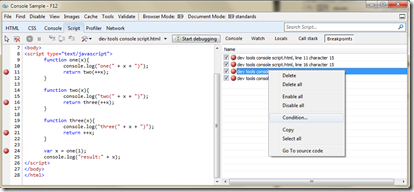
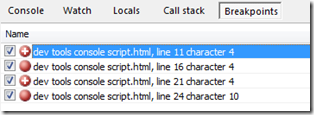
The Script tab’s Breakpoints pane lets you view and manage (disable/enable and delete) all breakpoints at a glance:
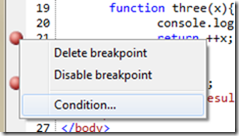
Conditional breakpoints can be set via the Breakpoints pane (above), or by right-clicking on the breakpoint indicator and choosing “Condition…”:
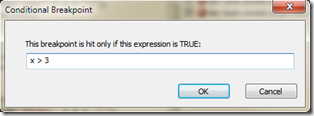
Enter the JavaScript expression for the condition to check (you have access to any in-scope variables as well):
Conditional breakpoints are displayed with a plus  indicator:
Next: Part 4 – Profiling
I hope you’ve enjoyed this look at working with JavaScript in the F12 Tools.
In the next article, we’ll take a look at profiling and optimizing JavaScript, using the F12 Tools Profiler tab to analyze script performance.
-Chris
