Forecasting Sales data with Excel mining - Step by Step Guide
Mining is a service and can be coded. This means that it is enterprise ready. Mining can be done using
- Excel
- SSDT
- PowerShell and
- SSMS
Analysis Services service should be "ON" for mining to run
Using a combination of basic PowerPivot and Mining Plugins for Excel 2013, let us create a forecasting model.
- Open Excel 2013
- Click on PowerPivot Tab
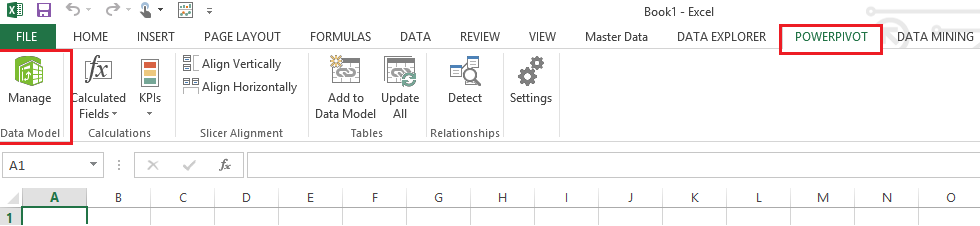
- Click on Manage – Manage helps to import relevant data. A new window opens up
- Click on “From Database” and choose SQL Server
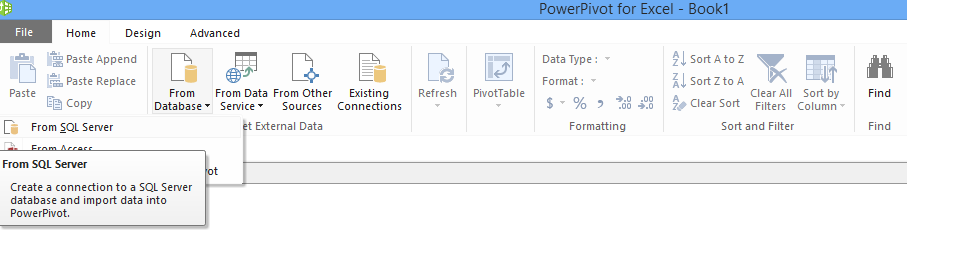
- Complete the data connection wizard
- Type in name of the server (Could be the same as name of your machine or localhost)
- Use Windows authentication or use SQL Server Authentication. Example: sa and pwd
- Connect to ContosoRetailDW and Test Connection
- Click Next to pick necessary tables. Choose the first radio option to select a set of tables
- Choose FactSales
- Select related tables (6 related dimension tables will be added)
- When you finish the wizard, data will be imported to PowerPivot i.e. memory
- Fact Sales has data for the year 2007, 2008 and 2009. Based on available memory choose a smaller dataset example: year 2009 only
- Click on Pivot Table and select flattened Pivot Table. A flattened Pivot table, removes sub-total
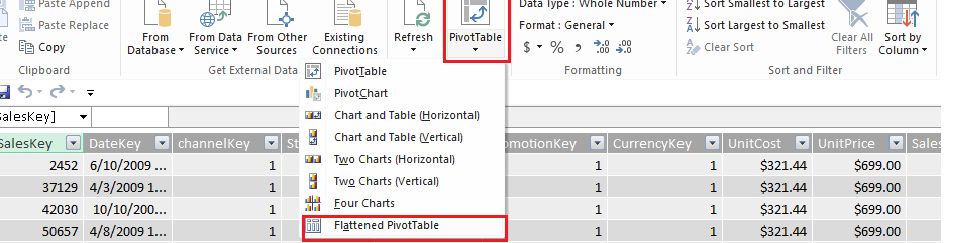
- Select Calendar Month on rows and SalesAmount on Columns
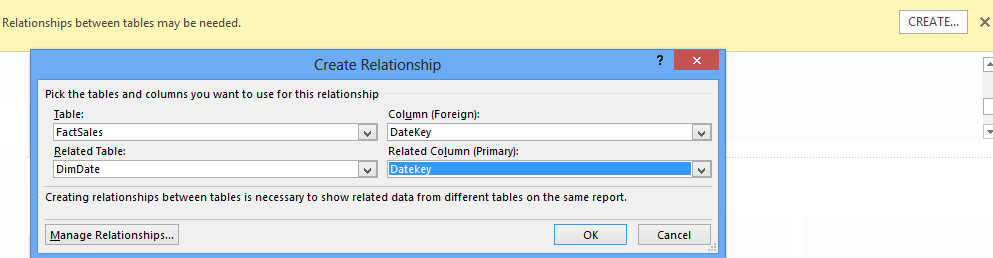
- A warning pops up asking you to create relationship between the tables
- Create relationship between Tables and columns of DimDate and FactSales as shown below
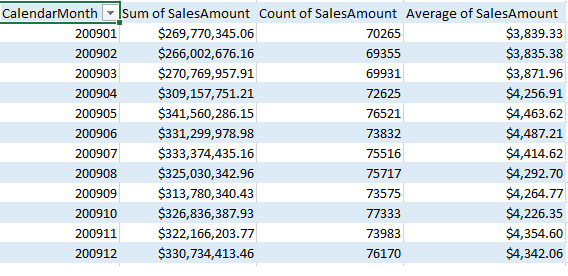
Create Count of Sales Amount and Average Sales amount
- Drag Sales amount to columns again
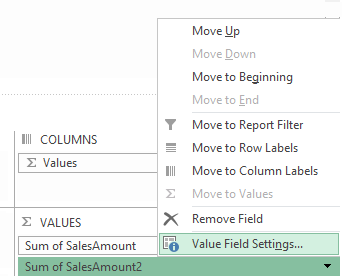
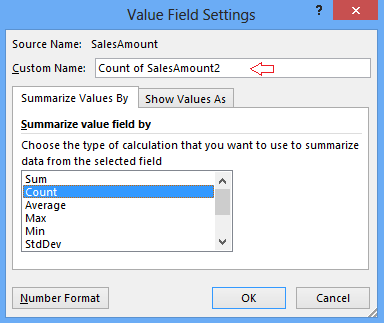
- Select Value field settings from the drop down
- Choose Count
- Repeat process a to c above to create average
- Resultant Pivot table will be as below
- Select and paste as values (so that there are no formulae in the numbers)
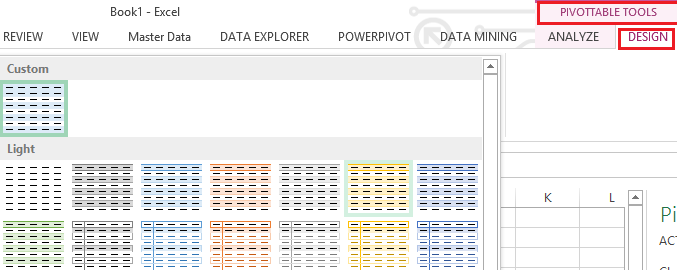
- Go to design and set selected data area as a table
- Click on the data mining tab
- With all cells with data selected, choose forecast from the ribbon
- Data range will be automatically selected
- Choose all columns for input i.e we use 3 variables here – Sum of sales, Count of sales and average sales
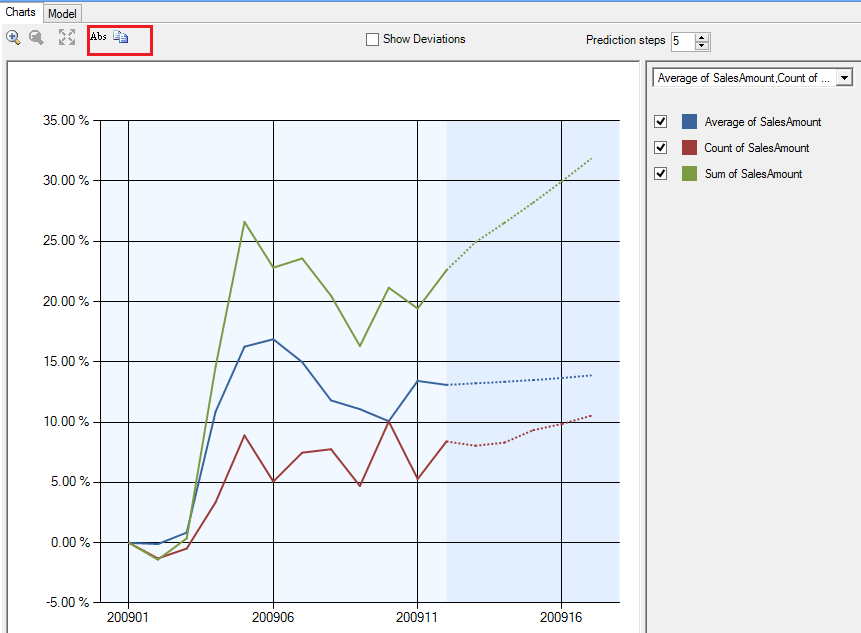
- A new chart pops up, where you can increase or decrease the number of prediction steps
- You can also toggle using Abs between absolute values and percentages.
- With percentages all 3 lines are visible clearly, where as with absolute the scale is such that only sales will be seen.
Count and Average when displayed on a chart with the same scale as sales amount will be almost invisible
-
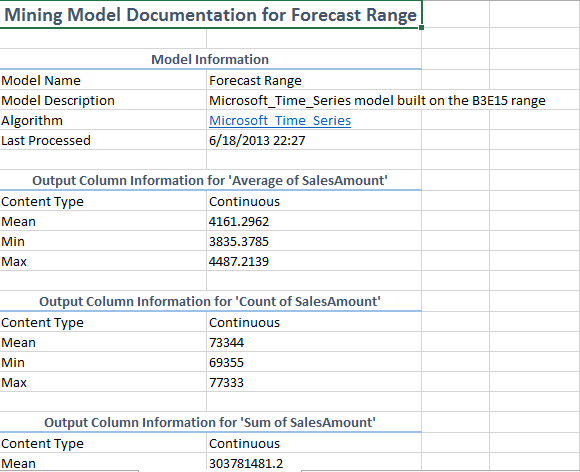
- Click on document model to see parameters used
- Click on Trace to see queries used
- ART xp is used for short term forecasting and ARIMA is used for long term forecasting
- Forecasted values use cross prediction ie predict based on all columns available as variants
- 65000 such parameters can be used in a model
Forecasting is used in medical field to trace temperature, Blood pressure and forecast for the future. It is used in mutual funds as an analyzer before investments are made.