A Simple Demonstration of What-If Analysis
NOTE This is the second of a series of entries on the topic of Building a Writeback Application with Analysis Services.
To demonstrate writeback with Analysis Services, I’ll leverage a simple model built around a project selection process that takes place within a fictional company. Through this process, projects are submitted from across the organization by a variety of users making writeback (with its associated audit trail which I’ll discuss in later entries) very appealing. However, the true driver behind the use of writeback is the need to evaluate uncertainty surrounding the organization’s objectives.
Projects are submitted as part of a mid-year planning cycle. At this point in the year, it’s always a bit unclear exactly what the organization’s priorities will be at the start of the next year. If revenue targets are off, the company may enter the year focused on cost-cutting. Alternatively, the company may find itself responding to changes in regulations, facing new competitive pressures, or seeking new opportunities for growth. As there simply aren’t enough resources to address all the requested projects, the business needs a way to prioritize them in the face of this uncertainty.
To deal with this uncertainty, projects are scored against a wide range of objectives. Scenarios are created which reflect different potential areas of focus within the company in the next year, and objectives are weighted relative to their importance within each scenario. Average project scores reflecting these weights can then be calculated so that decision makers can quickly determine which projects should receive priority under different circumstances. Astute project sponsors might also consider how their projects might fare better or worse under a variety of likely scenarios with some minor adjustments. (A review process keeps everyone’s scores honest.)
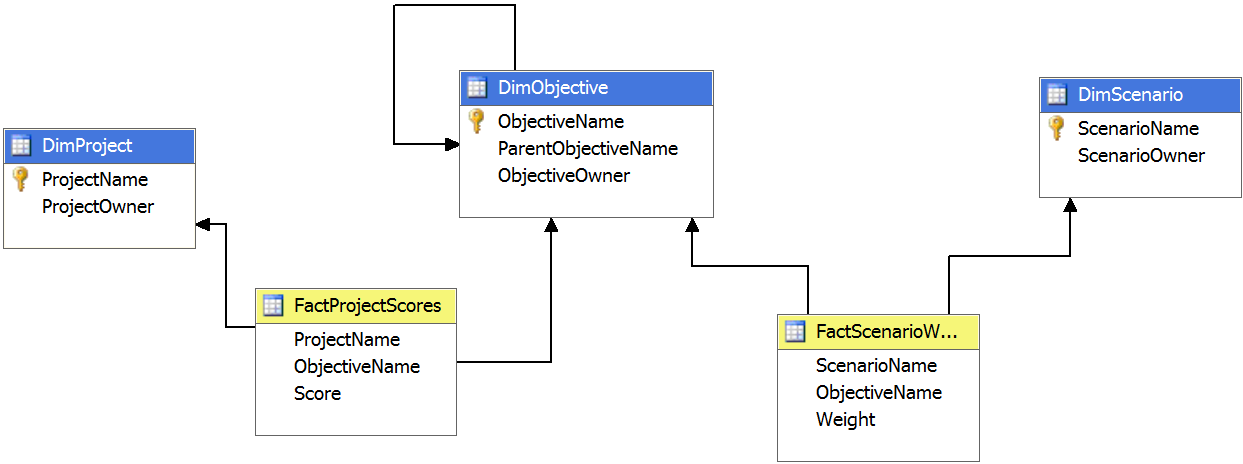
To support this, an Analysis Services cube is developed which relates scores to projects and objectives and weighs objectives under differing scenarios. The following is a diagram of this model:
To interact with this model, the analyst launches Excel 2010 (which has built-in writeback capabilities) and connects to the Analysis Services cube. A PivotTable is then constructed showing scores for Project 01 relative to various objectives under Scenario 1. Scenario 1 provides an even weighting to all the objectives allowing the user to concentrate on data entry. The following illustrates the results of the analyst’s work:
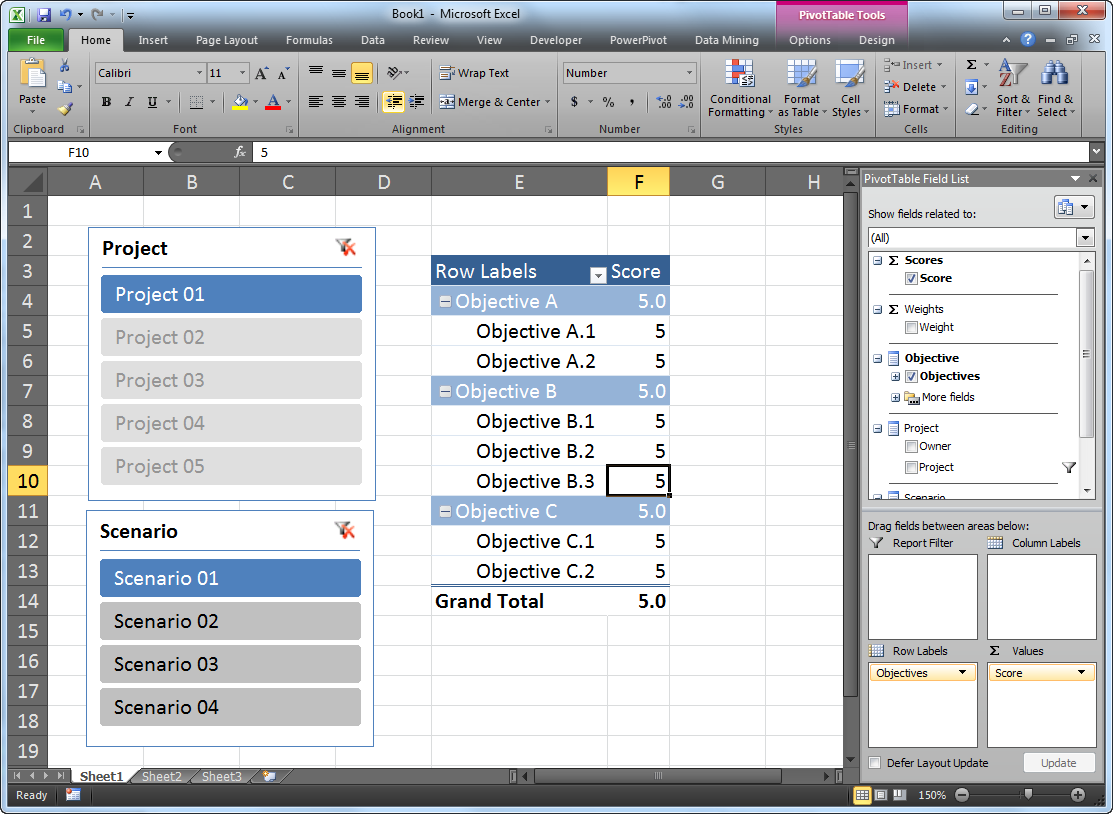
NOTE I will not be covering the basics of connecting to Analysis Services from Excel and assembling a PivotTable and Slicers. If you would like more information on these topics, please review this document.
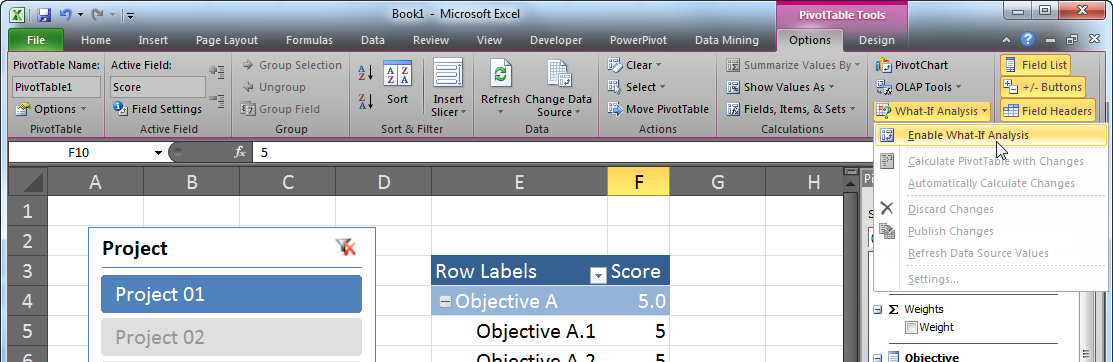
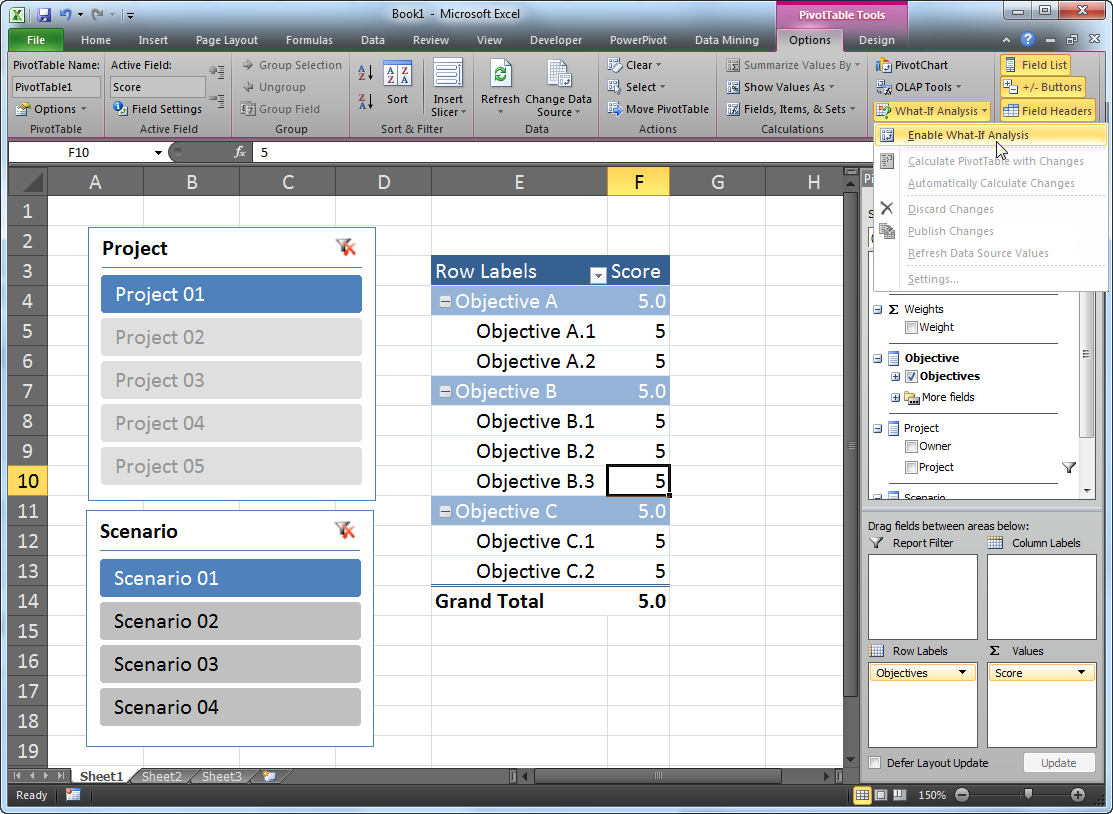
To enable writeback, the analyst selects a(ny) cell within the PivotTable and then navigates to the Options tab in the ribbon. He or she then selects Enable What-If Analysis located under the What-If Analysis item on the far right of the tab. This write-enables the PivotTable:
With the PivotTable write-enabled, the analyst changes the score for Objective B.1 from 5 to 3. If he or she then selects Calculate PivotTable with Changes, located under the What-If Analysis item in the Options tab of the ribbon, the average score for Objective B and the Grand Total are updated to reflect the data input:
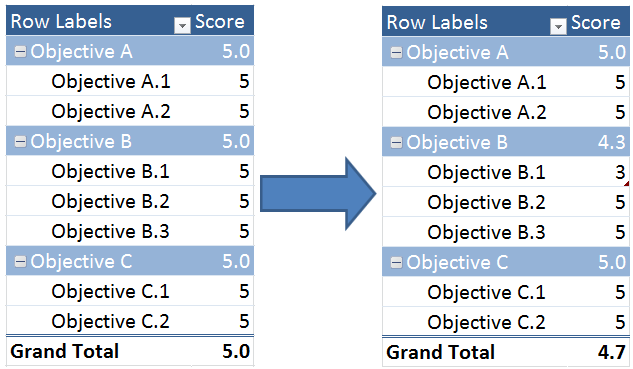
NOTE If you would like the PivotTable to automatically recalculate itself with each data entry, select Automatically Calculate Changes located under the What-If Analysis item.
Selecting Scenario 2 in the Slicer to the left of the PivotTable triggers another recalculation, this time using an uneven weighting to the objectives that’s appropriate to that particular scenario. For example, in Scenario 2, Objective B.1 receives slightly less weight than Objectives B.2 and B.3 as reflected in the shift in the average score for Objective B between Scenarios 1 and 2:
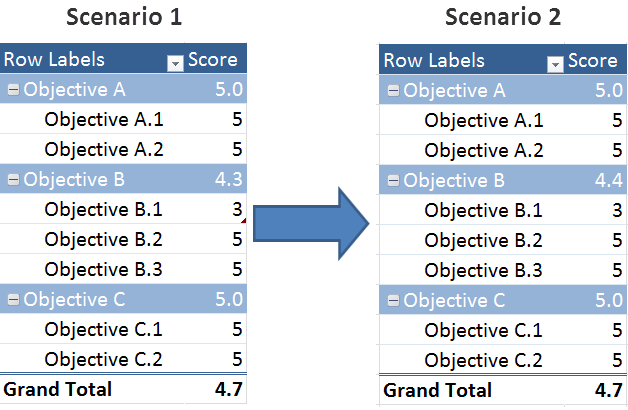
NOTE The difference in weighting is so slight that the impact of this one change is lost in the rounding of the Grand Total value.
Once the analyst has completed entering data and reviewing the results, he or she then chooses to either discard the changes to the cube, resetting it back to its original values, or publish the changes to the cube, altering the values presented to other analysts. This is done by selecting either the Discard Changes or Publish Changes options (respectively) under the What-If Analysis item.