Special Command—How to See Different Call Stacks Only? !uniqstack
I’ve been travelling a lot in the US and Latin America: that’s why you haven’t seen any new posts coming. Now I’m back! OK, just for a while, but it’s enough to write more articles. By the way, Buenos Aires (Argentina) is a beautiful place to know! J
This post introduces a command that is not well known: !uniqstack
As the name says, this command shows you all the distinct stacks. It works pretty much like k and its variations; however, it doesn’t show you repeated call stacks.
Is it helpful? It is when you are, for instance, debugging an application that spans several threads. You don’t need to see repeated stacks; just one is enough, got it?
Syntax
!uniqstack [ b | v | p ] [ n ]
Parameters
b Causes the display to include the first three parameters passed to each function.
v Causes the display to include frame pointer omission (FPO) information. On x86-based processors, the calling convention information is also displayed.
p Causes the display to include the full parameters for each function that is called in the stack trace. This listing will include each parameter's data type, name, and value. This requires full symbol information.
n Causes frame numbers to be displayed.
Here’s the way I like to use it:
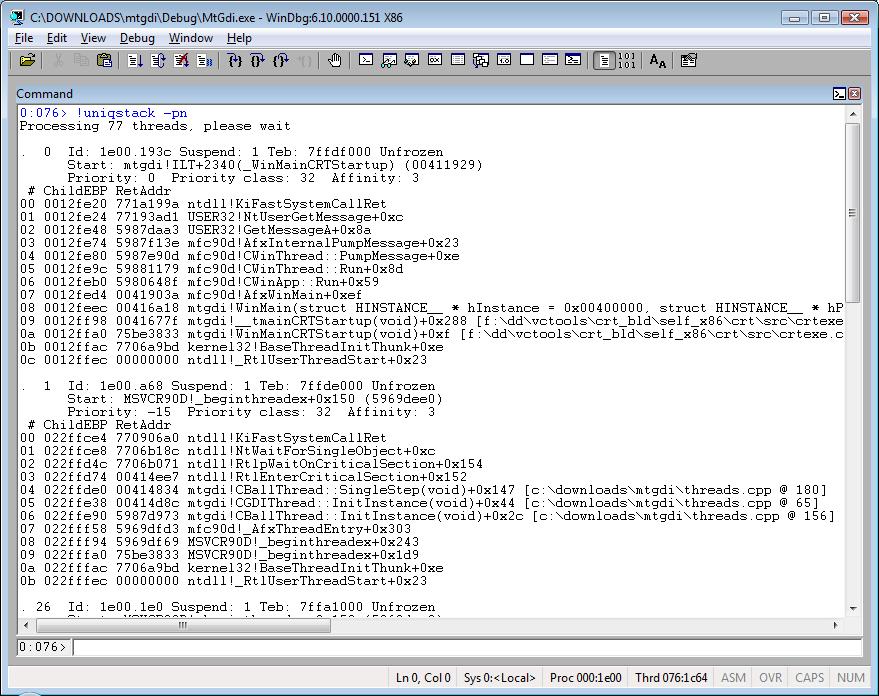
!uniqstack -pn
Tip: If you read the WinDbg documentation, you’ll notice it doesn’t mention the dash sign. You must to use the dash sign.
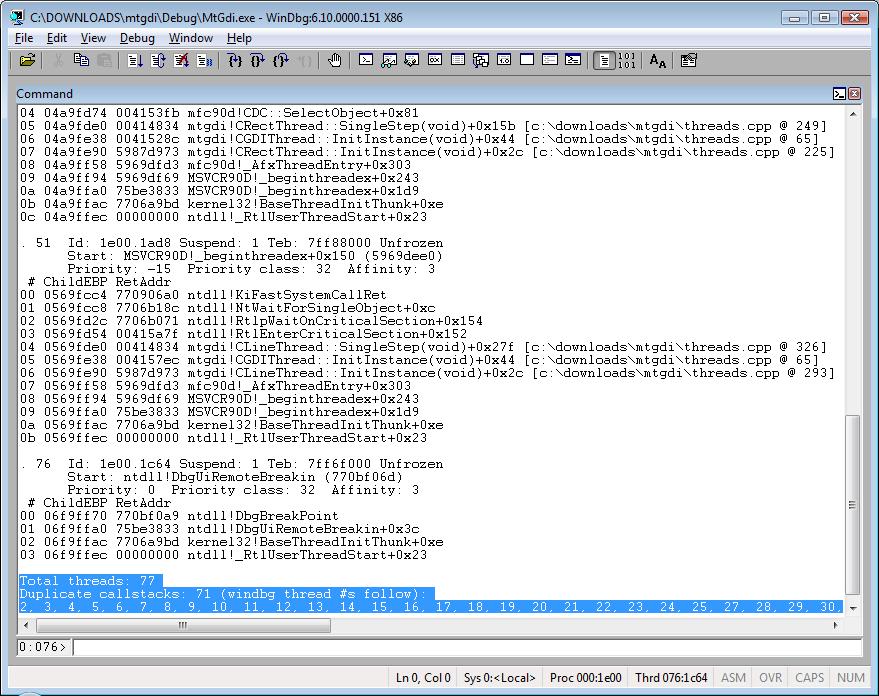
The stacks are displayed, ignoring all repeated call stacks:
Then you see the number of repeated call stacks: