ZTI MDT Debugger 1.0
I've had this tool sitting in a folder on my laptop half-finished for a few months but after a particularly frustrating problem with a script in a ZTI deployment I was encouraged to finish it!
The original MDTDebugger that I wrote is a great help for debugging tasks running in a litetouch (LTI) deployment task sequence, but it doesn't work for zerotouch (ZTI) deployments. The reason for this is that it needs to be able to display a window on the desktop of the computer that is running the task sequence; something that Systems Center Configuration Manager actively prevents. Well, this is no longer a problem because now there is a version of the MDTDebugger for ZTI deployments! This tool works in the same way as the LTI version but with a key difference: you open the debugging window on a different computer. In order to achieve this, I split the tool into two parts, the first part is the launcher that runs from the task sequence, and the second is the GUI that you use to help with the debugging.
To use this tool you'll need to do the following:
- Download the ZIP file that is attached to this post and extract it's contents.
- Copy ZTI_MDTDebugger_Launcher.exe into the scripts folder of the MDT package you created on your Configuration Manager server
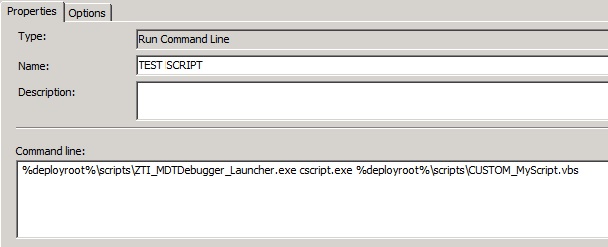
- In the MDT Task Sequence, edit the task you wish to debug by prefixing it's command line with the following: %deployroot%\scripts\ZTI_MDTDebugger_Launcher.exe - an example is shown below
- Run the deployment
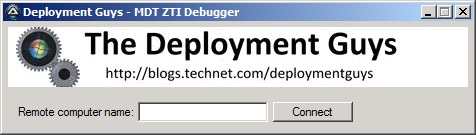
When ConfigMgr reaches your task, it will run the process as normal but will then pause (all you will see on the computer is that the task is still running, it won't state that it is paused). On a different computer, launch the file ZTI_MDTDebugger_GUI.exe, and you'll see the below window appear. Now, to start debugging you simply enter the remote computer name (the one running the task sequence) in the text box and press "Connect". Once connected, you will be able to debug your task in a similar way to how the LTI version of this tool works, and any failures will be captured by the debugger, preventing the task sequence from failing!
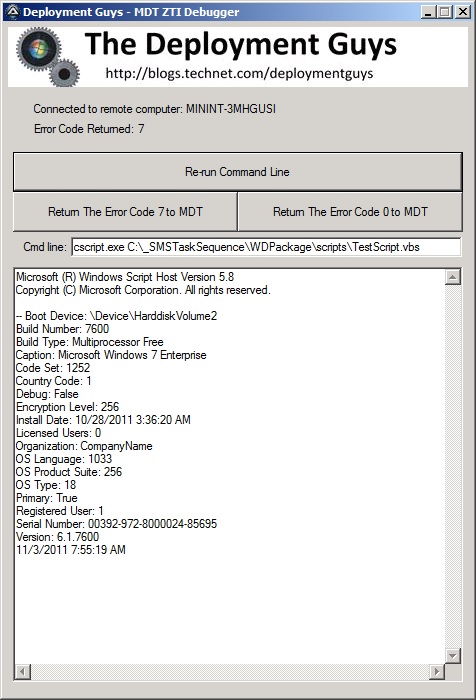 The above screenshot shows an example of the tool in action
To be able to use the tool successfully, you will need to be running the GUI portion of the tool with an account that has full administrative rights on the remote computer. Also, in order to be able to connect to the remote computer, you may need to temporarily disable the Windows Firewall via Control Panel. I've tested and used this tool successfully in deployment labs and it has no issues, but if you do find a bug or issue with it please post a comment here and I'll try to fix it! Also, if you have any feature suggestions then please also let me know.
This post was contributed by Daniel Oxley, a Senior Consultant with Microsoft Services UK
Disclaimer: The information on this site is provided "AS IS" with no warranties, confers no rights, and is not supported by the authors or Microsoft Corporation. Use of included script samples are subject to the terms specified in the Terms of Use