How to use Fiddler and HTTP replay to have an offline copy of your site
Very often, I’m asked to troubleshoot some client-side issue regarding web applications. Because, most of those times, I’m not onsite at the customer experiencing the issue, or because often this issue occurs on some remote site or branch office, it can sometimes be tough to replicate the problem or to gather enough and relevant information to troubleshoot or to try some real-time debugging techniques.
A very interesting way to achieve this is by using a combination of a very well-known tool, Fiddler, and a somewhat unknown tool called Http Replay. With these tools, we’ll work on creating an offline mirror of the browsing experience of a site, that can easily be packaged and sent to a developer for a more detailed look.
We’ll start by downloading and installing the tools. Just go here and here and get the bits to your machine. Then, execute both installers to setup the applications.
Our next step is to gather a Fiddler trace. This is something most web application developers are used to, so it should be familiar to you. Just fire up Fiddler and navigate to your desired web site.
The goal here is to visit every page and resource that you want to make available offline, so be sure to clear your browser cache before start collecting data so that all images and javascript files, which are normally cached are actually loaded and, therefore, show up on the Fiddler trace.
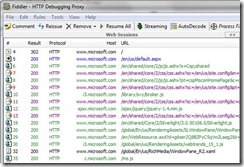
Here’s a sample of Fiddler after tracing www.microsoft.com:
Now, create a trace file, going to File, Save All Sessions and storing the saz file somewhere on your hard drive. This file holds all the necessary information for HTTP Replay to mimic www.microsoft.com offline, which is what we’ll do next.
HTTP Replay works as an HTTP proxy that either returns the stored response for an HTTP request it knows (because it’s stored on some trace file) or forwards the request to the actual server, if available.
To replay from a Fiddler log, you’ll need to:
- rename the "SAZ" file to "ZIP"
- extract the "raw" directory
- run HTTPREPLAY.CMD passing the "raw" directory as the logfilename
To start HTTP Replay, open a command prompt and cd to C:\Program Files\HTTPREPLAY or C:\Program Files (x86)\HTTPREPLAY on an x64 system. Next, execute a command similar to HTTPREPLAY.CMD <logfilename>, for example, HTTPREPLAY.CMD C:\temp\raw.
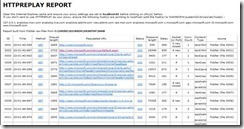
This is will fire up a browser that shows the requests contained in the trace file provided. It should be similar to this:
Note that these are the same requests that the Fiddler trace contained and that the screenshot above showed.
Now, just follow the instructions on the page: clear your browser cache, change the proxy to localhost:81 and click on the first link. For each request, the command prompt running HTTP Replay will show some output like this:
23:30:39:040 #0 - New connection accepted (127.0.0.1:64308)
23:30:39:083 #0 - 127.0.0.1:64308 -> :81 (2691 bytes / total : 2691 bytes)
23:30:39:084 #0 - GET https://www.microsoft.com/ [FOUND]
Each time a request is FOUND, it is returned from the trace file which is disconnected from the server. With this tool and the above steps, you can now replicate your site’s behavior and troubleshoot client-side easily.
As a last note, there are some interesting settings that you can use for HTTP Replay, the most interesting of which is the RESPECTTIMINGS option which makes HTTP Replay take as much time as the original request took to serve the response. However, for this you can’t use a Fiddler trace and you must use another tool called STRACE.
- Ricardo Henriques
(cross-post from https://blogs.msdn.com/ricardo)

