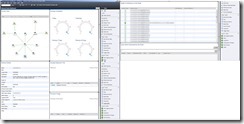
Network Monitoring in Operations Manager 2012
One of the best features in Operations Manager 2012 is network monitoring. Out of the box, Operations Manager gives you the opportunity to discover and monitor your network environment. In addition, you can execute reports against your network devices in a simple and single pane.
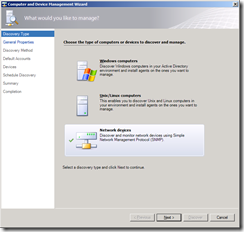
It is good to start by running a discovery against our network devices. For that purpose, go to the Administration tab and click on Discovery Wizard
Select Network Devices, and click on Next
On the General Properties page, enter a Name and a Description for the discovery rule. Under Select a management server or gateway server, select a server from the available servers’ list.
It is important to note that the selected server must have SNMP or ICMP access to the network device it is going to discover.
Under Select a management Pool, select a pool from the Available pools and click on Next
Resource Pool is another feature in Operations Manager 2012 which supports high availability. You will now have the option to select one or many management servers, group them in a pool, and assign your network devices to be monitored by the pool. If a server goes down from that pool, it will automatically failover any monitoring that is occurring on that management server to the other members of the pool.
Out of the box, All Management Servers Resource Pool is created which includes all management servers.
On the Discovery Method page, select Explicit discovery if you know which devices you want to discover. On the other hand, select recursive discovery if you don’t know much about your devices and thus you wish to do a recursive discovery starting from few discovered network devices.
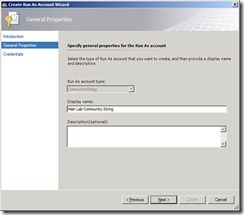
On the Default Accounts page, we will create a Run-As account. Click on Create Account and then on Next. Provide a display name and a description as shown below:
Click on Next and provide a read-only community string
Click on Create.
The interesting aspect is that if you have a large number of devices which require different community strings, you can specify them here.
Click on Next and on the Devices page, and then click on Import if you wish to import your network devices from a text file or click on Add to add your devices one by one.
On your Add a device page, type your device FQDN or IP address and select the Access mode and the SNMP version you want to use.
In the SNMP V1 or V2 Run As account, select the appropriate community string, or choose Use selected default accounts if you wish Operations Manager to do the matching for you and create the 1:1 relation between the network device and the community string. This is very useful if you are importing a large number of network devices that use a number of community strings.
Click Ok and then Next.
On the Include filters page, you can filter the discovered network devices in the case of a recursive discovery and filter them by device type as shown below:
Select the network device type you wish to include, click on Ok and then Next.
On the Exclude filters page, you can specify a network device type to be excluded from the discovery. The list of network device type looks similar to the one shown above.
Select the devices you wish to exclude, click on Ok and then Next.
On the Schedule Discovery page, set the scheduled date and time for running the discovery rule or select Run the discovery rule manually to run the rule manually.
On the Summary page, click on Discover to start the discovery and save the newly created discovery rule.
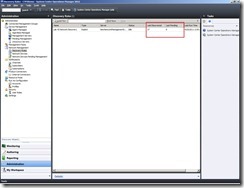
Once the discovery runs and gets completed, you will be able to quickly view the result of the network discovery by clicking on Discovery Rules in the Administration tab as shown below:
Network Devices that could not be discovered will be placed in the Network Devices Pending Management.
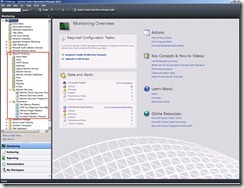
From the monitoring tab, you will find a list of sealed views and dashboards.
By default, the operations manager will monitor the active port/interface, the connection health, the VLAN health, and the HSRP group.
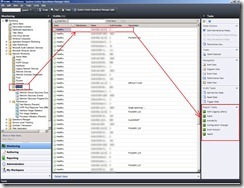
If you click on the VLANs view, and select any VLAN from your discovered VLANs, you will be able to navigate to its specific view or execute a report against it as shown below:
In OpsMgr 2007, you would need to go to the Reporting tab, open the report, look for the object, and add it. Now with OpsMgr 2012, you just need to select the object such as the VLAN, click on your desired report, and the report will open with the selected object being added.
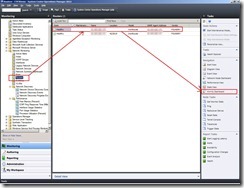
Similar to running a report, you can now run a dashboard in the same way. If you select any view such as the Routers view, select the router object and launch the Vicinity Dashboard from the right pane as shown below:
From the Vicinity Dashboard, you can also run the Network Node Dashboard.
The steps and screens in this article are provided from an Operations Manager 2012 CTP3 version and therefore might change in future releases of the product.
![clip_image001[4] clip_image001[4]](https://msdntnarchive.blob.core.windows.net/media/TNBlogsFS/prod.evol.blogs.technet.com/CommunityServer.Blogs.Components.WeblogFiles/00/00/00/85/01/metablogapi/2148.clip_image0014_thumb_1165CBF3.png)
![clip_image001[6] clip_image001[6]](https://msdntnarchive.blob.core.windows.net/media/TNBlogsFS/prod.evol.blogs.technet.com/CommunityServer.Blogs.Components.WeblogFiles/00/00/00/85/01/metablogapi/5228.clip_image0016_thumb_6B9BB75D.png)
![clip_image002[4] clip_image002[4]](https://msdntnarchive.blob.core.windows.net/media/TNBlogsFS/prod.evol.blogs.technet.com/CommunityServer.Blogs.Components.WeblogFiles/00/00/00/85/01/metablogapi/2061.clip_image0024_thumb_69E6D78A.jpg)
![clip_image001[8] clip_image001[8]](https://msdntnarchive.blob.core.windows.net/media/TNBlogsFS/prod.evol.blogs.technet.com/CommunityServer.Blogs.Components.WeblogFiles/00/00/00/85/01/metablogapi/2870.clip_image0018_thumb_4FB28034.png)
![clip_image001[10] clip_image001[10]](https://msdntnarchive.blob.core.windows.net/media/TNBlogsFS/prod.evol.blogs.technet.com/CommunityServer.Blogs.Components.WeblogFiles/00/00/00/85/01/metablogapi/3718.clip_image00110_thumb_394BF37B.png)
![clip_image002[6] clip_image002[6]](https://msdntnarchive.blob.core.windows.net/media/TNBlogsFS/prod.evol.blogs.technet.com/CommunityServer.Blogs.Components.WeblogFiles/00/00/00/85/01/metablogapi/6471.clip_image0026_thumb_76D88F9D.jpg)
![clip_image002[8] clip_image002[8]](https://msdntnarchive.blob.core.windows.net/media/TNBlogsFS/prod.evol.blogs.technet.com/CommunityServer.Blogs.Components.WeblogFiles/00/00/00/85/01/metablogapi/2768.clip_image0028_thumb_505660B8.jpg)
![clip_image001[12] clip_image001[12]](https://msdntnarchive.blob.core.windows.net/media/TNBlogsFS/prod.evol.blogs.technet.com/CommunityServer.Blogs.Components.WeblogFiles/00/00/00/85/01/metablogapi/7411.clip_image00112_thumb_613A4301.png)
