Why do we get “The function evaluation requires all threads to run”
Some of you might have ran into this situation where you try to evaluate a property or a method
during debug time, and get this message in the value cell of the watch:

There is a quick “workaround” to this issue.
If you look carefully, you will see a small round icon after the message:

Pressing on this icon will force the evaluation to continue,
which most likely will give you the result you were after:

Now, let’s dive into the technical details… Why is this happening?
By default, we tell Visual Studio debugger to try and evaluate properties implicitly.
This of course requires running code while we are braked, and not only display memory content.
Running code, might potentially change the state of the system, which is not always what we want.
For example, I might be increasing a counter every time the property is accessed,
which means that when the debugger will try to evaluate the property, my code will run,
the counter will be incremented, and my system state is changed, even though I am braked.
As the default is to implicitly evaluate, the debugger will always try to do that,
risking a system state change.
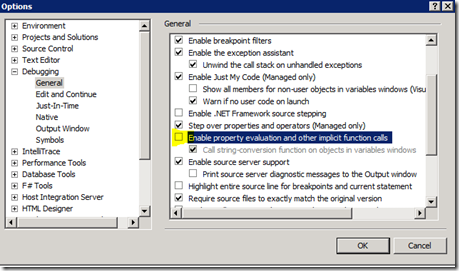
If you want to disable the implicit evaluation, remove the checkbox from the settings:

Without the checkbox, by default, properties will not be evaluated, and you will have to manually request evaluation each time:

Getting back to our initial error message… where does it come from?
We just said that by default the debugger will try to evaluate implicitly, so what’s stopping it?
When we break the debugger and try to evaluate a property which requires running code,
we can only run code in the current thread. All other threads are frozen to minimize the system state impact…
But, what if my property requires another thread to run in order to complete evaluation?
For example, if I am doing a remote call, I will most likely need the ThreadPool threads for that...
But all other threads are frozen… which will result in a “deadlock”.
The debugger has a protection measure against that, which gives a max of 5 seconds to the evaluation code to run.
If the code did not finish to run within the time limit,
For example, when we are blocked due to a frozen thread,
the watch will be “hanged” for 5 seconds, and after that evaluation will be aborted.
We will get this message to notify us of the problem:

This of course is not a comfortable user experience…
For this reason, the .Net Framework gives us the method:
System.Diagnostics.Debugger .NotifyOfCrossThreadDependency()
This method should be used by the code developer who wrote the property we are trying to evaluate.
If this property (or method…) knows that in order to complete evaluation,
we need to do a cross thread operation, we can call this method inside the property code.
The method will have effect only if a debugger is attached, and the code is running
for evaluation purposes, in which case the code will immediately abort
and notify the debugger via exception that we need other threads to evaluate.
The debugger will not allow it automatically, to avoid state changes, and instead,
will give the user the “The function evaluation requires all threads to run” message.
If the user decides it’s OK to let all threads run, he can push the icon next to the message,
which will cause the debugger to run the property code a second time,
this time with all threads running, and not aborting on the NotifyOfCrossThreadDependency method.
On next evaluation, if the code is getting to NotifyOfCrossThreadDependency again,
we will need to do this again.
Important note:
Since each evaluation attempt will run the code, it means that all the code that was running up
to the NotifyOfCrossThreadDependency method call will be running as well until aborted, so we need to make sure
we avoid making state changes up to this method, as we might not be able to complete the code
beyond this method call!
What if you see this message although you never called this method yourself??? This could happen, and it means you called 3rd code
(that could be part of the framework for example), that in turn called this method.

You can even run into situations where it only happens in specific breakpoints,
or you might need to approve the cross dependency only once during the debug session.
This could happen if the 3rd code is not calling the NotifyOfCrossThreadDependency method every time,
but only in specific cases, usually in initialization code…
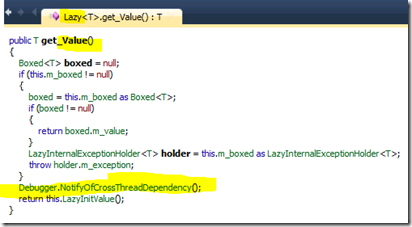
One of the popular examples for this are classes that use the Lazy<T>
initialization, and then use the Value property to get the instance.
This is because the Value property of Lazy is calling the notify method!
One of the ways to work around that is to make sure your code “warms up” these classes
before it’s time to evaluate them via the debugger.
The usage of Lazy might be common on Web scenarios and more..
Another common scenario is Task.Wait() which will also call the notify method
internally.
If you are writing your own custom watch visualizer and run into a similar state, you will get an exception
and can only notify the user that you can’t evaluate without the threads running…
Currently I have not found a way to work around this issue (besides code warm-up).
Eli.
