Analyzing My MSDN Blog
According to my blog dashboard, this will be post #150 for my MSDN blog. So this morning I thought I would do something a little different by providing some analysis on my blog.
I extracted the data from Community Server into an Excel spreadsheet so I could easily create some pivot tables and charts. [I don't believe that the MSDN blogs platform is running Harvest -- or if it is, I certainly don't have access to it.]
Here's a quick summary of my initial analysis:
| Metric | Views | AggViews | Comments | Combined Views |
|---|---|---|---|---|
| Total | 205,142 | 139,377 | 209 | 344,519 |
| Maximum | 12,240 | 2,855 | 13 | 14,445 |
| Minimum | 196 | 306 | 0 | 678 |
| Average | 1,359 | 923 | 1.4 | 2,282 |
Note that Combined Views is something I defined and is simply the sum of Views and AggViews.
The following post provides a good explanation of the difference between "Views" and "AggViews" in Community Server.
Eriksson, J-O (2006). Views statistics of your blog. 2006-07-24.
https://weblogs.asp.net/joeriksson/archive/2006/07/24/Views-statistics-of-your-blog.aspx
Here's the gist of it:
Generally speaking, "Views" is the number of times somone viewed a post on the web via a browser, and "AggViews" is the number of times someone viewed the post via the RSS and Atom feeds.
More specifically, the web view count is only updated in the EntryView control. This is displayed when you are viewing a single post. If you are viewing a list of posts, such as on the blog home page, the view counts of the posts are not updated.
Based on the second paragraph, the numbers shown above are not entirely accurate (specifically, they are less than the actual values) but my gut tells me they are reasonably close. In other words, while some people may simply browse to https://blogs.msdn.com/jjameson and start reading without ever clicking through on an individual post, I don't think this is a large number.
After all, how many times do you find yourself truly "browsing" a site compared with how many times you start from a search in order to quickly locate content of interest? Then, of course, there's the case where someone starts reading a post but then decides something like "hmmm...interesting...but not really what I was looking for...time to move on..."
Note that I had to do a little tweaking for the minimum values computed in my spreadsheet (in order to avoid showing all zeroes in the row) because I have a couple of unpublished posts that obviously haven't been viewed by anyone except me. I'll talk more about those in a moment.
I have to say that I was a little surprised by the total number of combined views. While I'm sure 345,000 pales in comparison to the likes of Scott Hanselman, Scott Guthrie, and Joel Spolsky, it's still a lot more than I expected for my humble blog. Seeing the average number of RSS views for each post exceed the 900 mark also makes me feel a little warm and fuzzy. So, for the roughly 2,800 of you that have subscribed to my blog at one point or another, I want to shout out a big "thank you!"
It's nice to know that the effort I put into writing blog posts are considered helpful for a number of people. Anyway, moving on...
Here's a chart showing the combined views for each blog post that I've created so far.
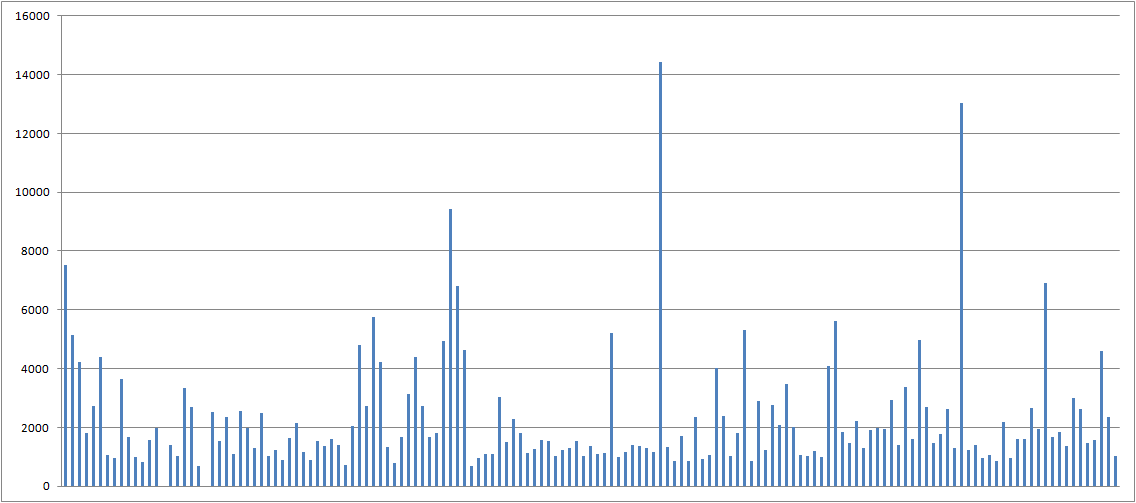
Figure 1: Combined views for each blog post
I didn't show the labels (i.e. blog post titles) on the X-axis for obvious reasons. I find it interesting how some blog posts are really "hot" in comparison with the average. Nothing mysterious here, this is obviously due to Internet search engines such as Bing and Google. More on that in a moment.
Looking at the chart above, one of the first things I was interested in identifying are my most popular posts, as well as my least popular posts.
Let's start with the top 10 posts:
| Rank | Post | Combined Views |
|---|---|---|
| 1 | Issues Deploying SharePoint Solution Packages | 14,445 |
| 2 | The Case of the Disappearing Hosts File | 13,029 |
| 3 | Dumping MOSS 2007 Variations - Part 1 | 9,417 |
| 4 | "Error Creating Control" when using Microsoft Office SharePoint Designer 2007 | 7,525 |
| 5 | Virtual Server Issues and Recommendations for MOSS Virtual Environments | 6,908 |
| 6 | Dumping MOSS 2007 Variations - Part 2 | 6,813 |
| 7 | Creating a Site Template in MOSS 2007 that Works in WSS v3 | 5,753 |
| 8 | Scope Dependencies for SharePoint Features | 5,607 |
| 9 | MOSS Development Environment and a Windows Update Bug | 5,307 |
| 10 | Installing Visual Studio 2005 Service Pack 1 | 5,199 |
Hmmm...nine of the top 10 posts are related to SharePoint. No big surprises there ;-)
What about the bottom 10 posts?
| Rank | Post | Combined Views |
|---|---|---|
| 151 | Adventures in Upgrading TFS | 0 |
| 150 | AutoEventWireup Issue in MOSS 2007 | 0 |
| 149 | ArgumentNullException with Optional PublishingPage.Description Property(with some thoughts on breaking the build, too) | 678 |
| 148 | Eliminate MBSA Warnings Using Default Security Settings Policy | 679 |
| 147 | Constraining Tables with CSS | 728 |
| 146 | DataNavigateUrlFormatString Does Not Allow "javascript:" | 773 |
| 145 | Add Rooler to Your Web Development Toolbox | 826 |
| 144 | New MSDN Theme on My Blog | 841 |
| 143 | KB 896861 and "Microsoft Fix it" | 849 |
| 142 | Latest Version of Opera Ignores Hosts File | 850 |
I suppose that I really should have thrown out the first two items because these posts are not published.
The Adventures in Upgrading TFS post was something I started back in March 2008 when I ran into a couple of snags upgrading the instance of Team Foundation Server 2005 in the "Jameson Datacenter" to TFS 2008. I thought I would eventually get around to finishing that post, but apparently not. Perhaps some other morning...however, I'm not sure it would help very many people after all this time. I certainly hope most organizations running TFS have upgraded by now.
The AutoEventWireUp Issue in MOSS 2007 post is something I really should finish. I started it back in June 2008 but somehow it fell off my plate. Stay tuned...I'll try to get to that this week. No, I won't "try" -- I will get to that this week. I promise.
In the meantime, back to this post.
It's also not suprising to see that many of the items in the bottom 10 are recent posts. As such, one would expect them to have fewer hits than others.
Since it's just so incredibly easy to do in Excel, I decided to see how my authoring of blog posts has varied over time.
Let's start with the total number of posts by year:
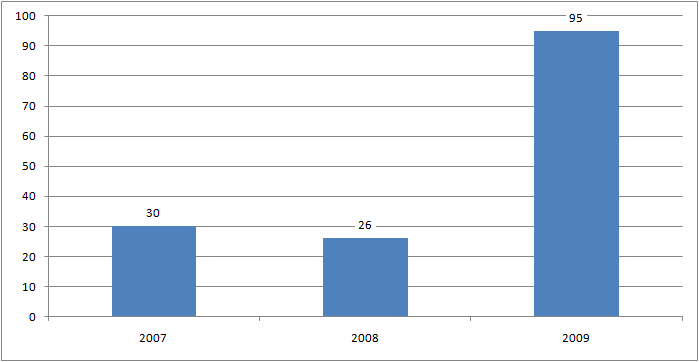
Figure 2: Blog posts created by year
Hmmm...apparently 2008 wasn't a very good year for me from a blogging perspective. Fortunately, the number for 2009 is much better -- and we still have almost two months to go!
Let's look at the total number of posts by month:
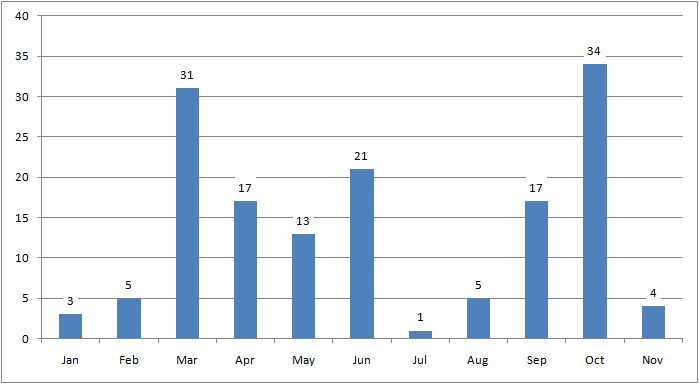
Figure 3: Blog posts created by month
Well, that certainly is, um...erratic. Oh, and where is December?!
Ouch...it looks like for the last two years I have completely neglected my blog in that month.
Will this year be any different? Hmmm...wait and see ;-)
I can tell you that I'll be taking quite a bit of vacation again this year in December and my wife won't appreciate it very much if I blog when I should be working on refinishing our master bathroom. However, I'll try not to skip that month entirely once again.
I read one of Scott Hanselman's posts a while ago that talked about calculating your PPM (Posts Per Month) -- or was it BPM? I can't remember. Anyway, it seems like I could definitely be a little more consistent throughout the year. Trying to maintain a steady rhythm when it comes to blogging is always a challenge when you consider how much else there is to do on any given day.
The last area that I want to cover in this post is with regards to Internet search results -- which I briefly mentioned earlier. In other words, while it is interesting that blog posts like Issues Deploying SharePoint Solution Packages and The Case of the Disappearing Hosts File are at the top of the list, what I find more interesting is why they appear at the top of the list.
Let's start with the most popular post. Drilling down on the 12,246 views in the Community Server dashboard (which does not include "AggViews") to see the list of referrals, I encountered the largest HTML table I've ever seen on a page (over 5,500 rows). After a couple of attempts, I managed to copy all of the data into my Excel workbook and then sort by Hits descending.
However, adding up the numbers for the top 10 referrals accounts for less than 5% of the 12,246 views for this post. Upon further inspection, I found that only 8,400 of the 12,200 views actually have referral data.
Breaking down the referrals by domain name, I found the following:
| Domain | Hits |
|---|---|
| google.com | 3,893 |
| google.co.uk | 628 |
| google.co.in | 519 |
| google.com.au | 310 |
| google.ca | 288 |
| google.nl | 211 |
| google.de | 198 |
| search.live.com | 129 |
| google.fr | 125 |
| decatec.it | 99 |
Note that the post was created back in June 2007, which helps explain why you see search.live.com instead of bing.com in the top 10 list.
To help me get a better feel for the Google vs. Microsoft ratio, I grouped the results into categories and subcategories.
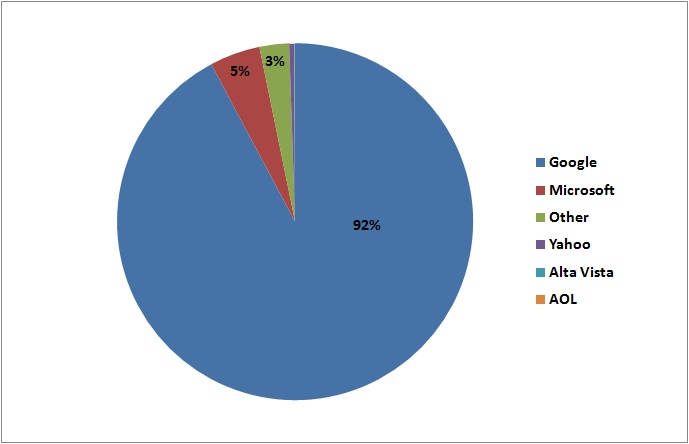
Figure 4: Referrals by category for post - Issues Deploying SharePoint Solution Packages
It turns out that the subcategories were really only interesting for the purposes of identifying the top-level categories.
What's up with Alta Vista and AOL? Does anyone still use those search engines? Evidently a few people in the last couple of years ;-)
I have a strong suspicion that if I went through the same exercise for my second most popular post, I would see very similar results.
I'm not sure how useful this information might be to others, but I found it very enlightening. It gives me some great things to keep in mind when I sit down to work on my blog.