Debugging the .NET framework source code
I am sure lots of us have been in the situation where, after hours of poring through compiled source code in Reflector whilst simultaneously trying to hold the values of hundreds of conspiratorial variables in our heads, we are left thinking that it would all be so much easier if we could just set a breakpoint in the compiled code and step into it. In this way all of the power of Visual Studio debugging tools would be available to us, making the diagnostic process a more familiar and user-friendly experience.
All is not lost. The Shared Source Initiative, and specifically the Reference Source Code Center, gives developers the ability to step into .NET framework source code. Actually this ability has been around for a while but seems to receive relatively little press. It therefore seems worth writing a post so as to get a little more momentum going around the subject.
By the way, this is described in the Visual Studio literature and yet I always seem to have trouble finding it. That probably says more about my inability to use IE bookmarks but hey, none of us is perfect!
Ok, create a Visual Studio 2010 console application and overwrite Program.cs with the following:
 using System;
using System.Collections.Generic;
using System.Text;
using System.Xml;class Program{
    static void Main(string[] args)
    {
        XmlReader r = XmlReader.Create(”https://helloworld”);
    }
}
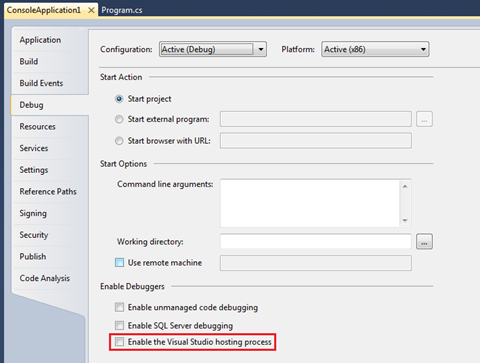
Go to Project-Properties-Debug and do the following:
- Uncheck the ‘Enable the Visual Studio hosting process’ checkbox
- Save the project
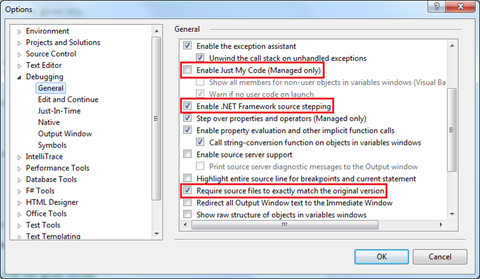
Now go to Tools-Options-Debugging-General and do the following:
- Uncheck ‘Enable Just My Code (Managed only)’
- Check ‘Enable .NET Framework source stepping’
- Check ‘Require source files to exactly match the original version’
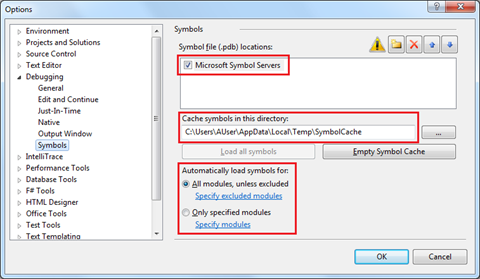
Now go to Tools-Options-Debugging-Symbols and do the following:
Check ‘Microsoft Symbol Servers’
Choose a suitable directory to store the symbols
Choose either to load all symbols or specified modules
- The former is the safest approach but also the bigger performance hit
Click ‘OK’
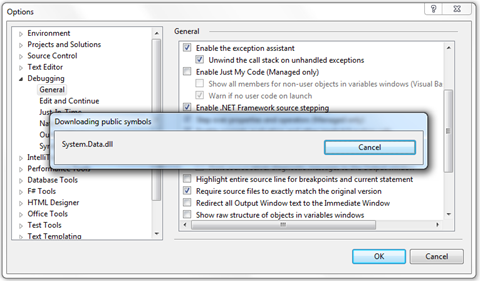
Whilst the symbols are downloading from the reference server you will see something like the following:
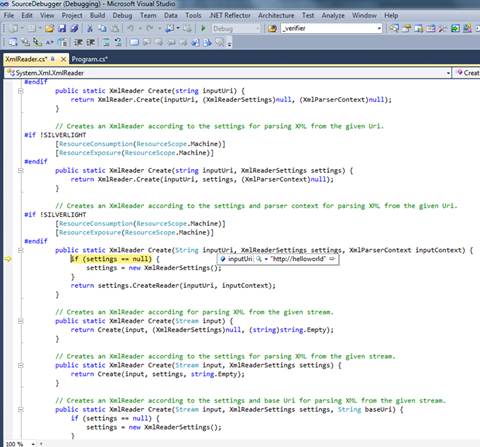
Finally, set a breakpoint on the line of code in the console app and press F5. Once the breakpoint has been hit, press F11 to step into the framework code, in this case System.Xml.dll (NB – you may have to agree to a EULA the first time you try this).
You will see something like the following:
You are now able to debug framework code in the same way as your own custom code.
NB - You may experience problems with the odd variable here and here and this is most likely due to the issue described in the FAQ section of the reference source website. Additionally, there is a great MSDN forum where relevant topics are discussed. Also, not all of the source code symbols are available. You can see what is available here.
Finally I would recommend switching off this functionality when it is not needed as it is a significant performance overhead in Visual Studio.
Written by Bradley Cotier
