Debugging like a Boss with Visual Studio!
There are a couple of things that I would like to go thru in
this post in what I consider the most important things to know while debugging
a .net application in visual studio… In this post I will assume that you know
how to attach to process and debug local processes that way.
Debugging remote processes (No Authentication)
Disclaimer!!
First I would like to make clarify that this is not intended
for production purposes, you should rely mostly on logging to diagnose and detect
issues on your applications… Debugging in production with intrusive programs is
strongly discouraged for live environments as they might cause users to get
hanged in debug breakpoints. The steps
that I’m describing below I use them mostly when debugging onebox issues, this
is, that I’m debugging a virtual machine (that I own) where a set of components
(that I own) have been deployed.
This is a very powerful feature to know, sometimes you need
to debug your application on a remote machine, so here are the steps that you
need to do
Copy the remote debugger from your dev machine to the one
where the process you are intending to debug is located. Note that the Remote Debugger is specific to
the version of visual studio that you will be using for the debugging session; these
are the typical locations for VS 2012/2013 (it may vary depending on your
installation):
Visual Studio 2012
C:\Program Files (x86)\Microsoft Visual Studio
11.0\Common7\IDE\Remote Debugger
Visual Studio 2013
C:\Program Files (x86)\Microsoft Visual Studio
12.0\Common7\IDE\Remote Debugger
The Remote debugger is not particularly big 50-ish MBs so
copying it into the target machine should not be a big problem.
Now run msvsmon.exe. This should open the following Window
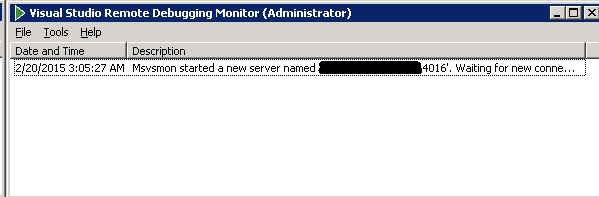
Now go to Tools->Options->No Authentication.
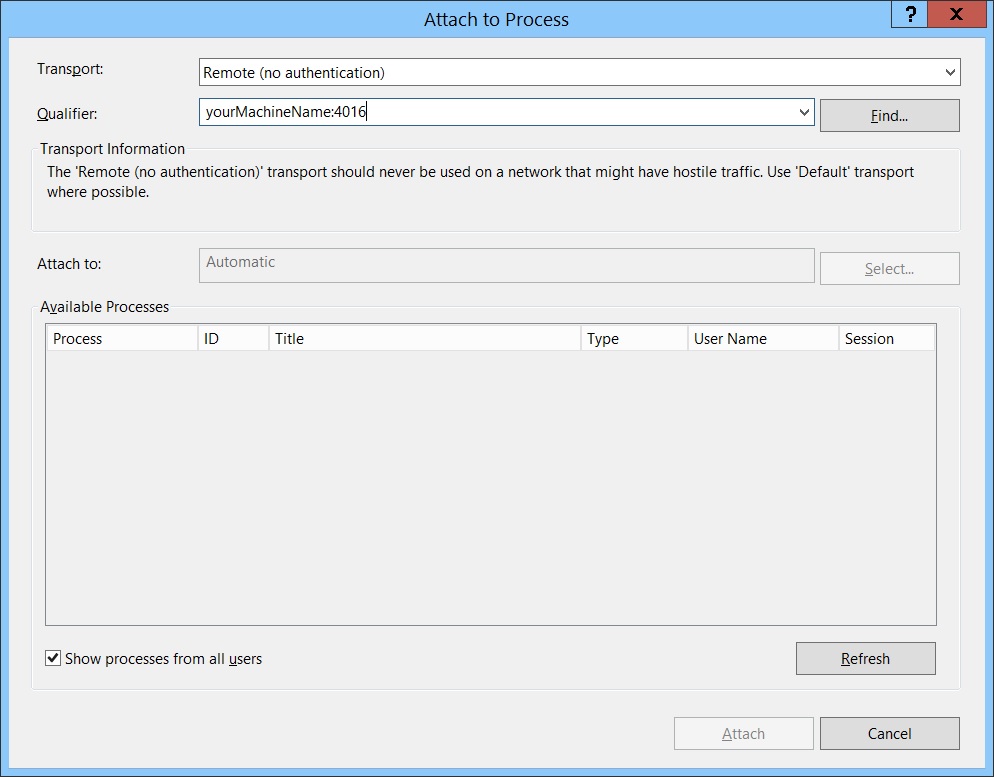
Now you can go to visual studio (on your dev machine) and go
to attach to process, from the transport drop down select Remote, and then use
the full name with the port as displayed in the msvsmon.exe in the Qualifier textbox,
now press enter and you should see the processes show up in the “Available Processes”
go to the process that you want to debug and then click on the Attach button.
Note:
As with any debugging
you will need the PDBs of the dll that you are trying to debug, for more
information about PDBs you can read this
fantastic article from wintellect’s John Robbins
My Breakpoint is Not Working!!! “:(
Learn to love the Modules window! Whenever you are debugging
a process and your breakpoint is not breaking and there is an exclamation mark
on the breakpoint saying that no symbols have been loaded for the current process
it usually means that! This means that
Visual Studio was unable to find the PDBs and therefore Visual studio cannot infer
the mapping between your binary and your code.
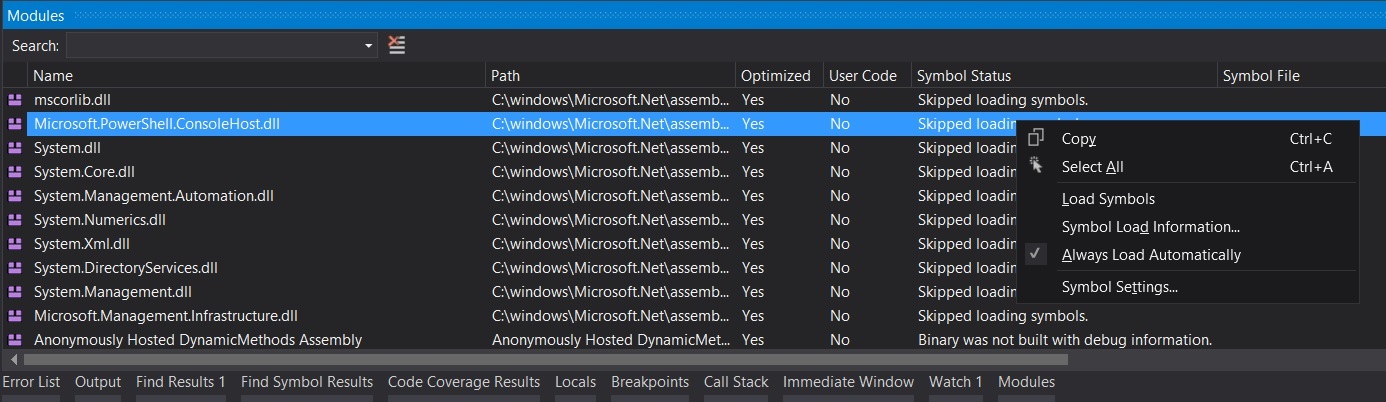
Now… Q: how can you find out where the dlls are being pulled
from and where it is trying to get the PDBs from? A: The Modules Window!
When debugging: Go to Debug->Windows->Modules… your
breakpoint is not working? Go to the modules window find your dll, and check
the reason why the PDBs are not getting loaded, if you have the PDBs at hand
you can right click and do “Load from Location” and then you can tell it where
to load it from.
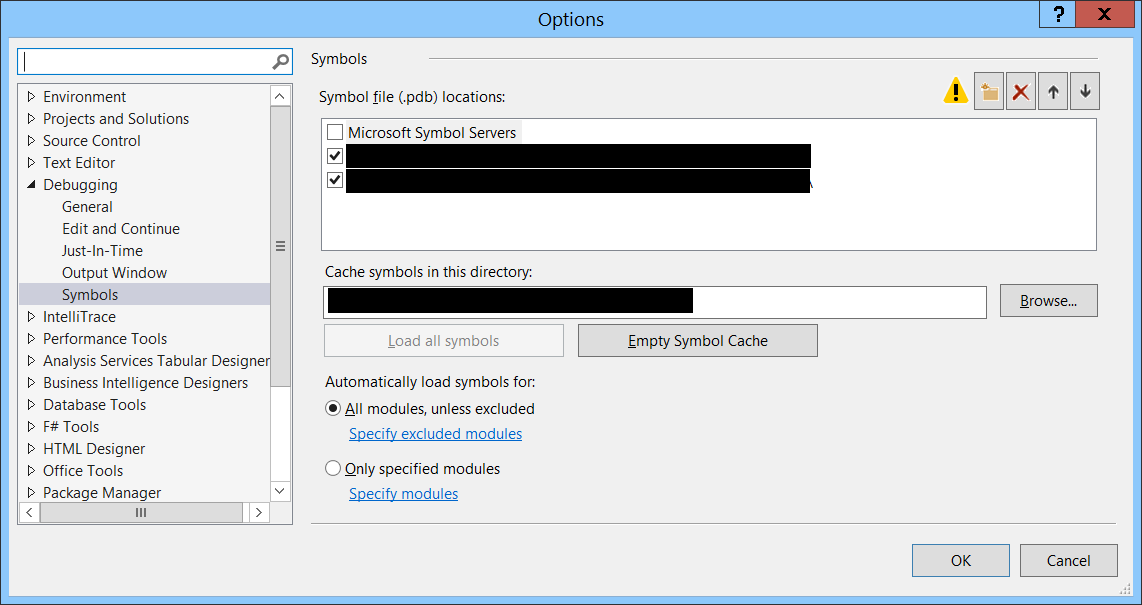
Loading Symbols Automatically
In visual studio you can define paths from where to load
PDBs dynamically, you do this by going into Tools->Options, then from the
options on the left select Debugging->Symbols, and in here you can define a
location where your build system might store the PDBs automatically.