View your Agent Health in OMS
Summary: Learn how to view and monitor the health of your Windows and Linux agents in OMS.
Hi everyone, Nini here, and today I’m happy to announce that you are now able to view and monitor the health of your Windows and Linux agents in OMS. With agent heartbeat events, you can gain insights into the performance, availability and geo-location of your agents. If you have SCOM agents or direct agents connected to OMS, we will automatically start to generate and collect these agent heartbeat events. Best of all, they do not count towards your data volume.
First, go into Log Search and input Type=Heartbeat:
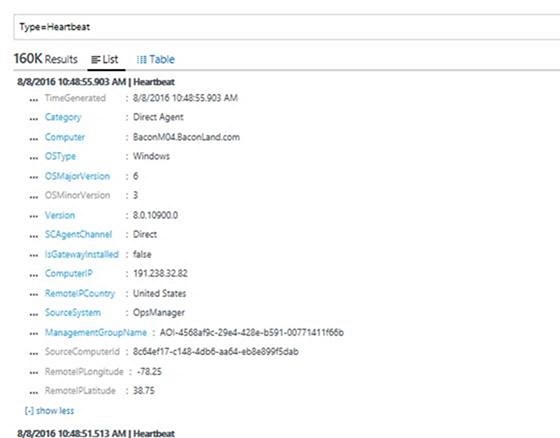
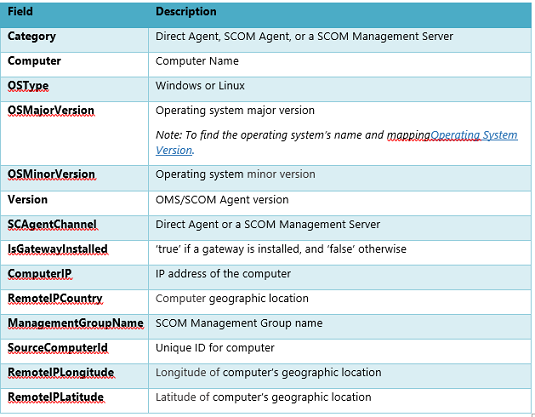
Now that you can see a list of all computers and servers with Windows and Linux agents installed, you can view the following fields:
Visualize Heartbeat Events
Using the View Designer, you can create an Agent Health solution to visualize these results. You can dive into key counters that you care about, such as the distribution of your agents and agent heartbeat overtime.
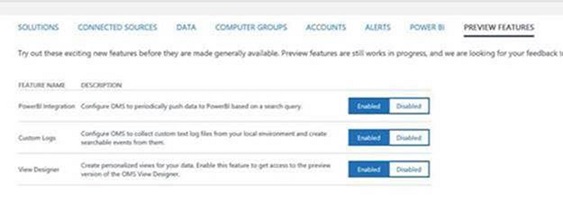
Be sure to enable the View Designer feature in “Preview Features” below, before following the next steps.
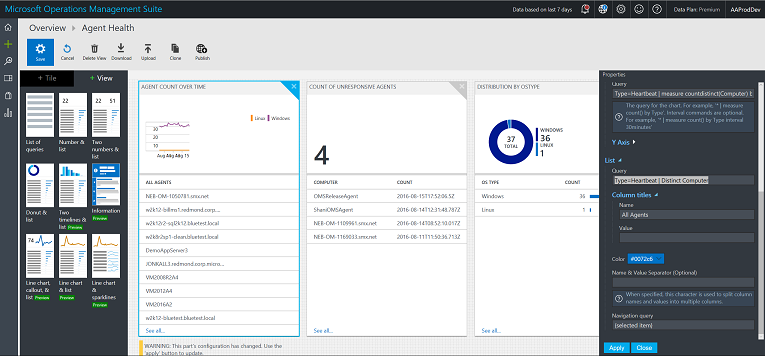
Next, open the View Designer, and populate each blade by using the following queries. In this example, I’m populating my Overview tile to see the total number of agents in my environment and the Agent Count over Time blade to view a trend of my number of agents over time.
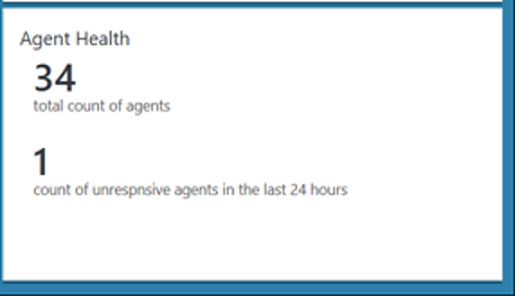
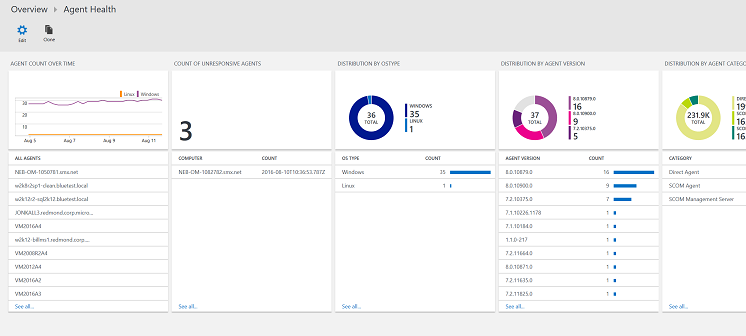
For the Overview tile, I use these queries to get the total number of agents, and a count of unresponsive agents in the last 24 hours:
Type=Heartbeat | distinct ComputerType=Heartbeat | measure max(TimeGenerated) as LastCall by Computer | where LastCall < NOW-24HOURS
In the Agent Count over Time blade, I use this query to get a trend of my number of agents over time:
Type=Heartbeat | measure countdistinct(Computer) by OSType
I use this query to get a list of all my computers in the “All Agents” list right below the trend:
Type=Heartbeat | Distinct Computer
For the other blades in my Agent Health solution, I use the following queries:
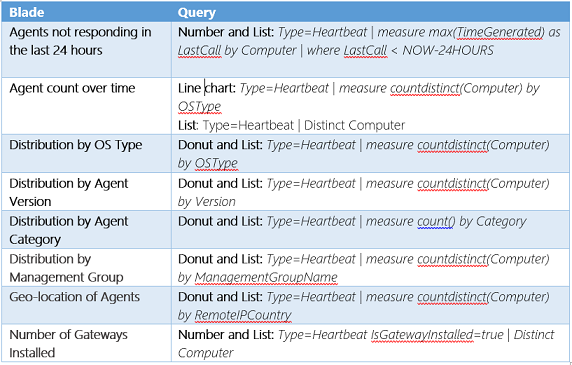
Screenshots of the completed solution:
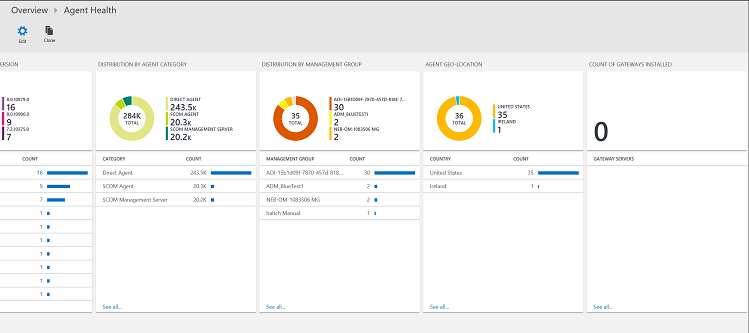
And voila! You’re can now get a quick sense of your agent health and set up from a glance at this dashboard.
Create Alerts to track Agent heartbeating
In addition to visualizing heartbeat events, you can also create alert rules so that you get notified when an agent has stopped heart beating for 24 hours or longer. You can simply do this by creating a log search and then selecting the Alert button to create and configure the alert.
Using this log search, Type=Heartbeat | measure max(TimeGenerated) as LastCall by Computer | where LastCall < NOW-24HOURS, here’s what the alert rule should look like:
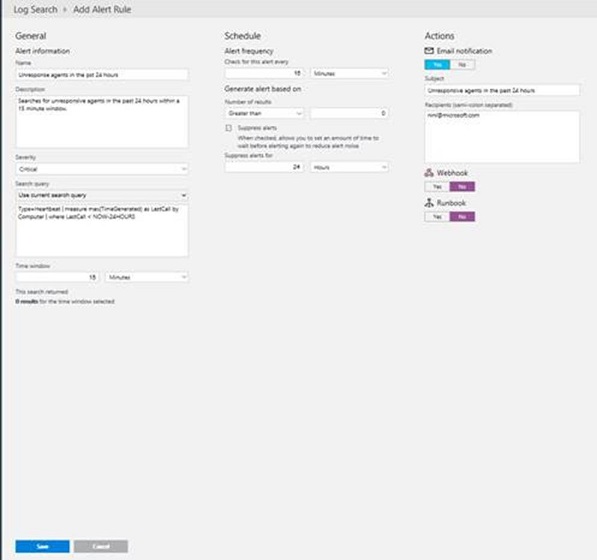
Click save, and your alert should start running immediately. To read more about how to set up alerts in Log Analytics, see Alerts in Log Analytics.
What's next?
We are currently working on an Agent Health OMS solution so that you can have a more in-depth and insightful visualization in OMS.
That’s all I have for you today. If you have any feedback or questions, please comment below.
Priscilla Nini Ikhena
Microsoft Operations Management Team