"Report" authoring and PPS Planning Business Client
Sorry this isn't a super technical post, most of this information should be pretty well known by now. Ah the glory of having your own blog: you get to say a lot of junk that everybody already knows but you repeat anyway just to sound important....
Off hand there are 6-ish ways I can think of to describe how to author a report on PPS Planning data. Not all of them involve the PPS Planning Business Client (aka the add-in) but I will spend the most time with the add-in based options. The first 2 and the last 1 are the most common based on my experience.
1. Use the Action Pane interface
This interface was inspired by the PivotTable authoring interface. The major difference is how members are selected in PPS vs native Excel. In PPS we try as much as possible to just render the output of an MDX query. PivotTable's have a lot of built in organization and sub-totaling. Partly this is because they are a general purpose tool and can connect to many data sources besides just OLAP cubes. The "member picker" is the common PPS dialog that allows for advanced searching and filtering of members. In the add-in we take the dynamic or static set that the user creates and generate the MDX for the query from that. This dynamic interface is probably where the biggest difference between a Matrix and a PivotTable stems from.
PPS action pane: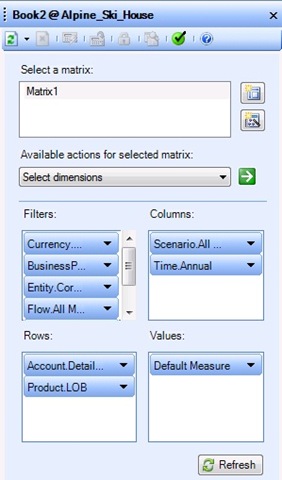 PivotTable task pane:
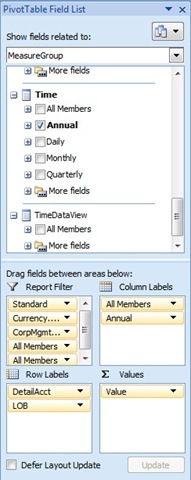
With these 2 pictures creating similar reports you can see that the lower areas describing which members or fields are selected are pretty similar. PPS hides most of the details about how to connect to the cube from the user so creation of a matrix is simple compared to the steps needed to create a PivotTable and I'm not going to go into those differences. But as far as picking members for display there are very few similarities. The PPS Member Picker allows similar static selection like a PivotTable, but it also brings OLAP concepts out front and center. Here I've selected all the top level members by choosing the children of all in the Member Picker. In the PivotTable field selection there is no equivalent so I've selected all members...
PPS member picker: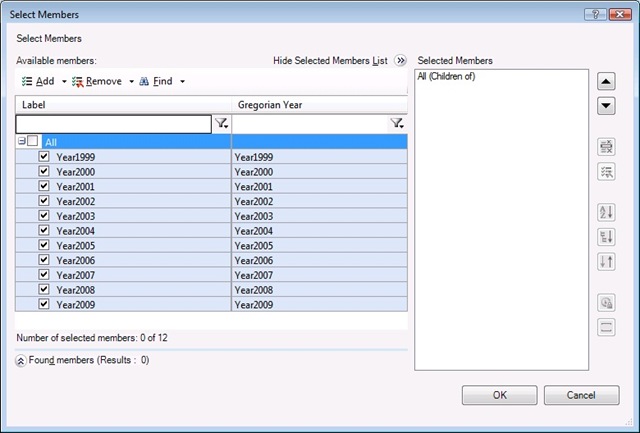 PivotTable field selector:
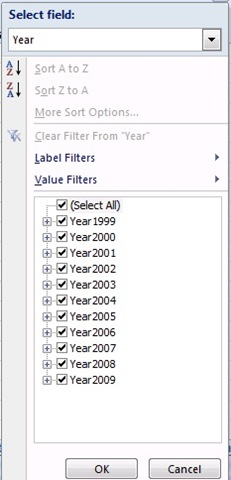
Since the PPS member picker was designed assuming OLAP and the PivotTable UI was designed assuming multiple data sources, it isn't too surprising that there are differences. In the future, I expect we'll see more specific BI/OLAP UI in the built-in Excel functionality and as it becomes available PPS will take advantage of it. The PPS UI I think gets a great advantage from the dynamic selection sets because of the assumption of an OLAP data model. In both of these shots when the calendar is extended and new year's data is available the reports will automatically update. But in the PivotTable example you will always be stuck with a grand total appearing which may not make sense since it the annual data may not be meant to be added together. How OLAP nicely does a lot of the hard work at aggregating data and providing natural query mechanisms is another post.
2. Use the Report Wizard
This is really handy when you want to to create custom calculations in your matrix. I didn't work on this authoring experience and sometimes it feels like I have to do a lot of clicks to finish a report. But many people love this interface, and in future versions it sounds like its capabilities and template will be expanded.
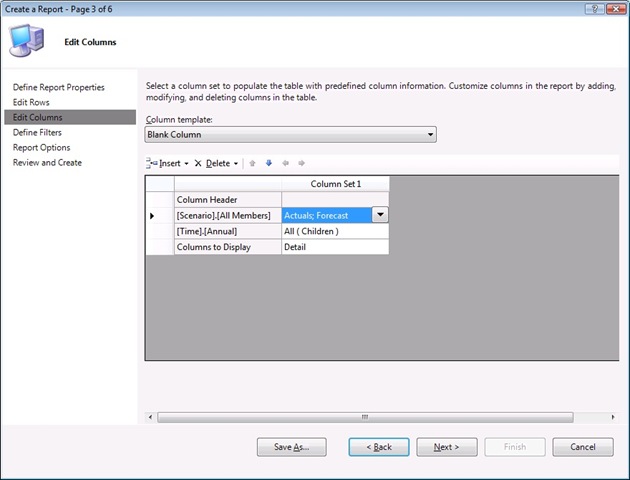
The main limitation with the Report Wizard vs the Action Pane is that under the hood the query definitions are stored differently. So you have to choose ahead of time which UI interface you want to use. (You cannot switch once the matrix is created.) But once the MDX is generated internally everything is rendered the same. So really this choice is a matter of authoring style. There's a lot more hand holding with the wizard and you get calculations, and it seems to be a popular choice based on the questions I've seen in the TechNet forums.
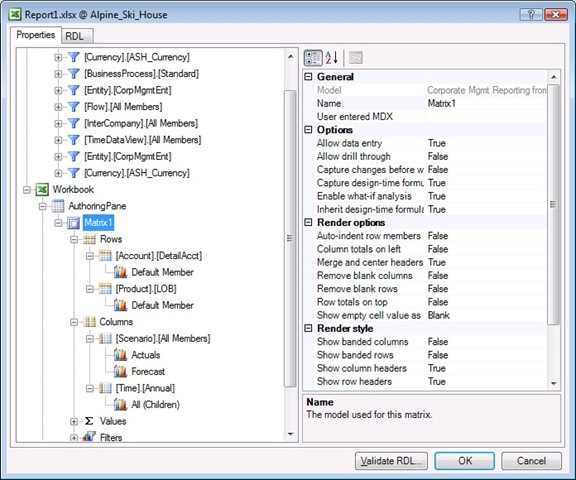
3. Use the Report Properties Editor
Generally people don't use this for basic authoring tasks. This is just where you come when its time to change a matrix property like "Allow data entry" or to connect a filter to multiple matrices. But it was actually the first fully functional authoring interfaces we had during development. All properties are exposed here and its a fairly "techie" interface. I trust our users to be smart and capable and disagree that its too difficult. But I don't disagree that there's not a lot of bells and whistles here in terms of making it super friendly.
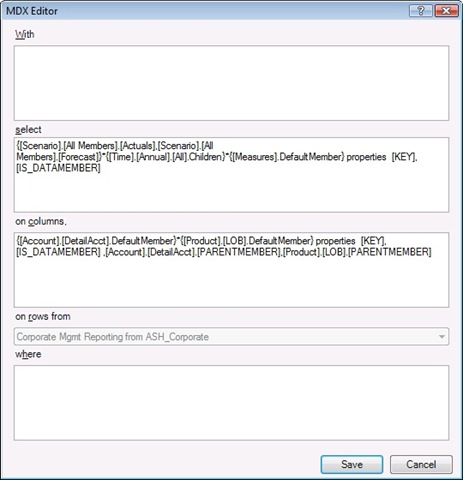
4. Use custom/raw MDX and RDL
Finally, when all our UI fails you we let you enter straight MDX. Unfortunately we make you split the query up into 4 parts so you can't just cut-and-paste. That's probably the only limitation here. Every MDX feature is available here and we will parse the query and insert filter selections.
And to be even more extreme, we also have the RDL tab in the Report Properties Editor which shows you what the raw format of the report looks like. (It's XML using the Reporting Services 2005 schema, with some PPS extensions to store our extra metadata that doesn't fit in the RS2005 schema).
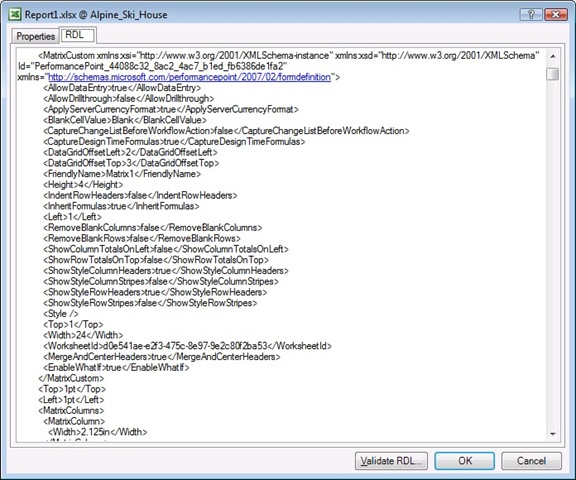
Working at both this low level RDL and using custom MDX is another post: there are some scenarios where the UI doesn't expose some functionality very conveniently but the rendering engine can support it.
5. There is no 5....yet
With apologies to Monty Python, it is very much possible to look at how the Alpine Ski House (ASH) sample gets installed and see how to use PPSCmd to populate reports and RDL. But this is even more tedious than #4. But for completeness sake I thought I would mention it since it might be a scenario partners are interested in. Using a framework like the ASH installation could be a quick way to get some template based or pre-generated vertical installations up and running quickly. But at this point in time I don't know of anybody who is doing anything like this...
Along these lines I also don't know of any 3rd party authoring tools with explicit PPS support, but am very much looking forward to them being created. The fact that the add-in rendering engine just needs to run an MDX query should make this pretty straightforward.
6. But...don't forget about other PPS and/or OLAP tools
Dashboards and scorecards created by the Monitoring & Analytics side of PPS are another kind of important report. Management Reporter is obviously another hugely important kind of report authoring environment. I just don't know enough about M&A and MR to speak with any authority about them yet...
Because when a PPS Planning model is deployed, it is deployed to an AS 2005 cube. So just about any OLAP client can work with a PPS model. The PivotTable in Excel is one of the better known clients in MS-land. But the general point I want to make is that just because there is such a term as "report" in the add-in doesn't mean that this is the only kind of "report" you can make using PPS Planning data. SQL Reporting Services can connect both to the SQL tables and to the OLAP cubes.
The primary goal of the add-in I worked on is to facilitate data-entry to planning models. The next goal is to support reporting. But you should realize that the possibilities for creating reports are nearly limitless...
If anybody has some good links to M&A or MR blogs or resources about reporting against PPS Planning models w/o using the add-in lmk and I’ll edit this post with the links. In the meantime looks like I'm going to be alternating a HOWTO with a general post for as long as I can keep coming up with general post ideas...