Desired State Configuration (DSC) Nodes Deployment and Conformance Reporting Series (Part 3): Working with the conformance endpoint
This blog post covers how to deploy/configure, and work with the conformance endpoint. It includes details about the type of information returned, as well as sample ways to generate reports with meaningful data.
Configuring Conformance Endpoint
Similar to the pull service endpoint, we can use the xDscWebService resource from the DSC resource kit to configure a conformance endpoint. The configuration used to deploy both endpoints is available in the first post of this series. Note the requirements (xPSDesiredStateConfiguration module namely, also included in the DSC Resource Kit – This is also explained in the first blog post)
Note As of today, the conformance endpoint needs to be deployed on the same system as the pull service endpoint. This is because the status of each target node gets stored in an Access database (devices.mdb) on the system that is configured as pull service endpoint. The conformance queries the same database for the target node status.
Exploring Conformance Endpoint
Once the configuration is complete, we can access the conformance endpoint at https://<computername>:<portnumber>/<EndpointName>/PSDSCComplainceServer.svc. So, from our example, this URL will be https://localhost:9090/DscConformance/PSDSCComplianceServer.svc. So, if everything worked as expected, we should see similar output from the endpoint as shown here:
The Status method provides the configuration run status for each target node that is configured to receive configuration from the pull service endpoint. If we access the Status method, we will see browser output similar what is shown below:
Make a note of the highlighted section (bottom-right corner) in the previous screenshot. This shows how many target systems are available in the pull service inventory. If a pull client hasn’t received any configuration from the pull service endpoint, it won’t get listed in the Status method output. The output that we see in the browser isn’t any helpful. However, we can use this browser method to understand more about the Status method and what type of output we can expect from the method. This is done using the meta-data operation.
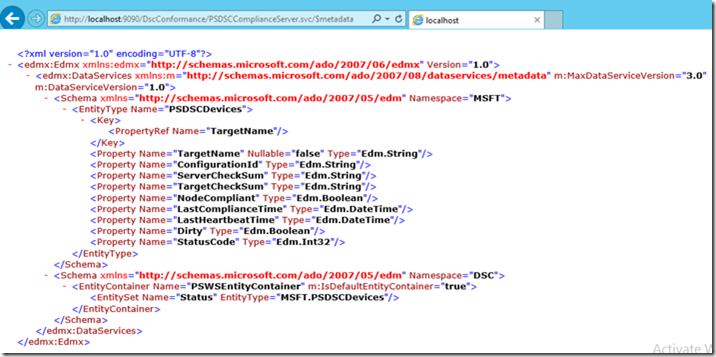
To see the meta-data from the Status method, append $metadata to the conformance endpoint URL.
The XML output seen in the above screenshot gives an overview of all properties that will be a part of Status method output. Here is a quick summary of these properties and what they mean.
Property Name |
Description |
TargetName |
IP Address of the pull client |
ConfigurationId |
GUID configured as the ConfigurationID in the meta-configuration of the pull client |
ServerChecksum |
Value from the configuration MOF checksum file on the pull service endpoint |
TargetCheckSum |
Value of the checksum from the target system |
NodeComplaint |
Boolean value indicating if the last configuration run was successful or not |
LastComplianceTime |
Last time the pull client successfully received the configuration from pull service |
LastHeartbeatTime |
Last time the pull client connected to the pull service |
Dirty |
Boolean value indicating if the target node status is recorded in the database or not |
StatusCode |
Describes the Node status. Refer to PowerShell team blog for a complete list of status codes. |
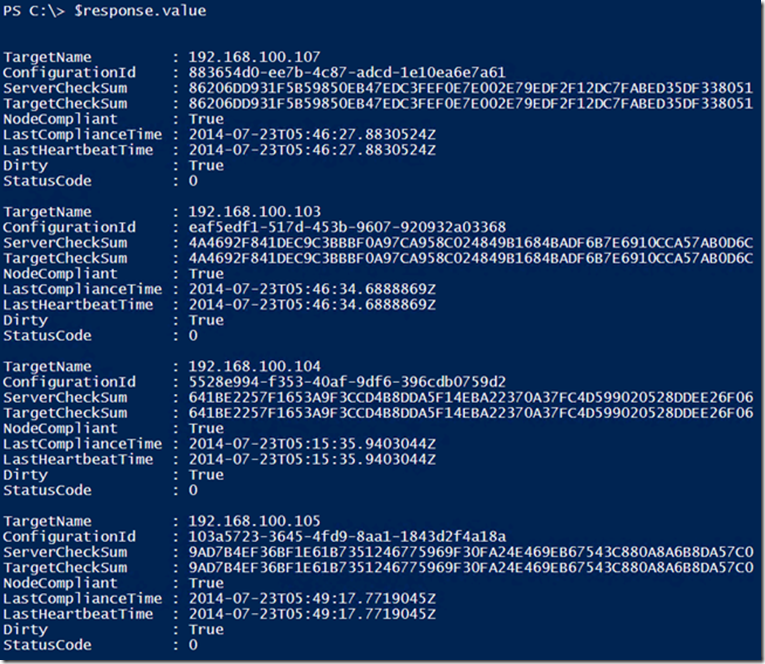
We can see the values of these properties using the Invoke-RestMethodcmdlet to query the oData endpoint.
| 001002003 | $response = Invoke-RestMethod -Uri 'https://localhost:9090/DscConformance/PSDSCComplianceServer.svc/Status' -UseDefaultCredentials -Method Get -Headers @{Accept="application/json"}$response.value |
In the above example, I have specified –UseDefaultCredentials switch parameter. This is required as the Conformance endpoint uses Windows Authentication. The Value property from the web service response includes the output from the Status method for each target node.
Understanding Conformance status and Reporting
As you see in this output, everything seems to be working fine in my deployment and all target systems are in perfect sync with the pull service endpoint. Once again, as explained in the introduction for this blog post series, the NodeCompliantproperty in the output does not indicate if the target system is in desired state or not. It only indicates whether the last configuration run was successful or not. So, let us test that by placing a buggy configuration MOF for one of the target nodes. For demonstration purposes, I will create a configuration script to include a custom DSC resource that does not exist on the target system. So, when this configuration gets received on the target node, it should fail because of missing resource modules.
| 001002003004005006007008009010011012013014 | Configuration DummyConfig { Import-DscResource -ModuleName DSCDeepDive -Name HostsFile Node '883654d0-ee7b-4c87-adcd-1e10ea6e7a61' { HostsFile Demo { IPAddress = "10.10.10.10" HostName = "Test10" Ensure = "Present" } }}DummyConfig -OutputPath "C:\Program Files\WindowsPowerShell\DscService\Configuration"New-DscCheckSum -ConfigurationPath "C:\Program Files\WindowsPowerShell\DscService\Configuration\883654d0-ee7b-4c87-adcd-1e10ea6e7a61.mof" -OutPath "C:\Program Files\WindowsPowerShell\DscService\Configuration" |
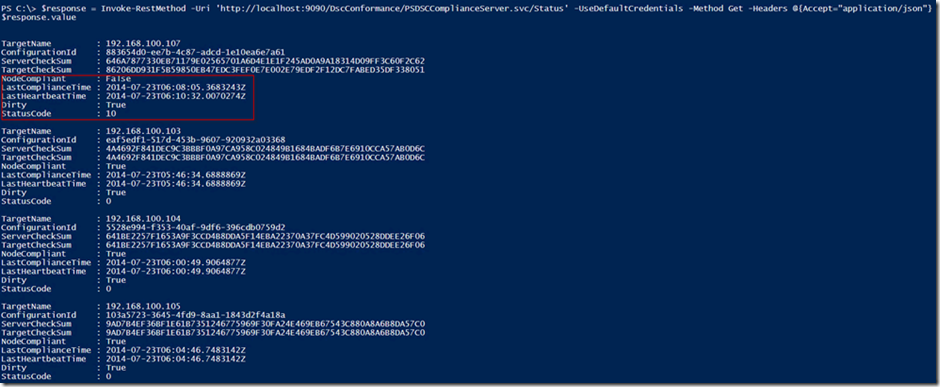
Once I changed the configuration on the pull service endpoint, I ran the scheduled task manually to pull the configuration and it fails as the HostsFile resource does not exist on the pull service endpoint for the target system. So, at this moment, if we look at the Status method again, we should see that the NodeCompliant status will be set to False. To get the right statuscodevalue, we need to run the schedule task again or wait for the pull client to connect to the pull service again.
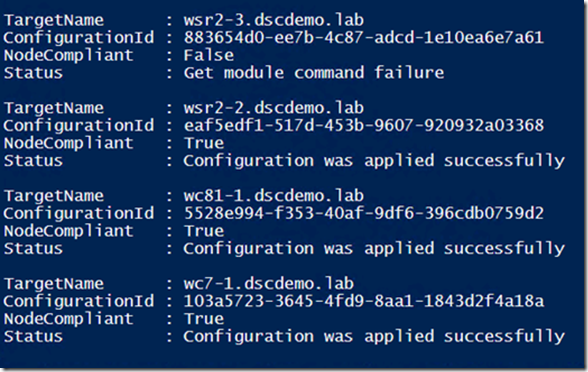
As you see in this output, the NodeCompliant state is set to False and the StatusCode is set to 10. So, what is StatusCode 10? From the PowerShell team blog, I understand that it means there was a failure in getting the resource module. Wouldn’t it be good if I can see the text description of the code instead of an integer value? Also, the IP address as a TargetName won’t make much sense to me. So, when I generate a report, I’d like to see the computername of the target system instead of IP address. How can we achieve that?
Yes, with a little bit of PowerShell! ![]()
| 001002003004005006007008009010011012013014015016017018019020021022023024025026027028029030031032033034035036 | $statusCode = @{ 0='Configuration was applied successfully' 1='Download Manager initialization failure' 2='Get configuration command failure' 3='Unexpected get configuration response from pull service endpoint’ 4='Configuration checksum file read failure' 5='Configuration checksum validation failure' 6='Invalid configuration file' 7='Available modules check failure' 8='Invalid configuration Id In meta-configuration' 9='Invalid DownloadManager CustomData in meta-configuration' 10='Get module command failure' 11='Get Module Invalid Output' 12='Module checksum file not found' 13='Invalid module file' 14='Module checksum validation failure' 15='Module extraction failed' 16='Module validation failed' 17='Downloaded module is invalid' 18='Configuration file not found' 19='Multiple configuration files found' 20='Configuration checksum file not found' 21='Module not found' 22='Invalid module version format' 23='Invalid configuration Id format' 24='Get Action command failed' 25='Invalid checksum algorithm' 26='Get Lcm Update command failed' 27='Unexpected Get Lcm Update response from pull service endpoint’ 28='Invalid Refresh Mode in meta-configuration' 29='Invalid Debug Mode in meta-configuration'}$response = Invoke-RestMethod -Uri 'https://localhost:9090/DscConformance/PSDSCComplianceServer.svc/Status' -UseDefaultCredentials -Method Get -Headers @{Accept="application/json"}$response.value | Select @{Name='TargetName';Expression={[System.Net.Dns]::GetHostByAddress($_.TargetName).HostName}}, ConfigurationId, NodeCompliant, @{Name='Status';Expression={$statusCode[$_.StatusCode]}} | Format-List |
Note: These status codes come can also be found in this blog post.
Note: In case you are wondering, the computer names used in this specific demo are different than the ones in the previous blog post, because this sample was created in a different environment. It does however work with any pull and conformance endpoint, as long as you use the appropriate URI.
So, what we see now is more meaningful. In this demonstration, I have only four target systems. But, when you have more target systems, it will be good to see some sort of visual indication for systems that have issues applying or working with configurations. For starters, we can use PowerShell to generate something. We can use some simple HTML to build this.
| 001002003004005006007008009010011012013014015016017018019020021022023024025026027 | Function Get-DscConformanceReport { param ( $Uri = 'https://localhost:9090/DscConformance/PSDSCComplianceServer.svc/Status' ) $response = Invoke-RestMethod -Uri $uri -UseDefaultCredentials -Method Get -Headers @{Accept="application/json"} $NodeStatus = $response.value | Select @{Name='TargetName';Expression={[System.Net.Dns]::GetHostByAddress($_.TargetName).HostName}}, ConfigurationId, NodeCompliant, @{Name='Status';Expression={$statusCode[$_.StatusCode]}} #Construct HTML $HtmlBody = "<html><body style='font: Calbiri;'>' $TableContent="<Table><tr style='color: #fff; background: black;'><th>TargetName</th><th>ConfigurationId</th><th>NodeComplaint</th><th>Status</th></tr>' foreach ($Node in $NodeStatus) { if (-not ([bool]$Node.NodeCompliant)) { $TableContent += "<tr style='color: #fff; background: red; border=1;'>' } else { $TableContent += "<tr style='border=1;'>' } $TableContent += "<td>$($Node.TargetName)</td><td>$($Node.ConfigurationId)</td><td>$($Node.NodeCompliant)</td><td>$($Node.Status)</td></tr>" } $TableContent += "</table>" $HtmlBody += $TableContent + "</body></html>" #Generate HTML file $HtmlBody | Out-File "$env:Temp\DscReport.HTML" -Force Start-Process -FilePath iexplore.exe -ArgumentList "$env:Temp\DscReport.HTML"} |
What the function generates is not a fancy HTML report. It just highlights all rows with NodeComplaint set to False. I am pretty sure that people with good JavaScript kills can beautify this report and include many other details.
In the first release of DSC, the conformance endpoint gives only limited information as we saw so far. For starters, the current functionality is good to understand if configuration run itself is complete or not, how many target systems are available in the deployment and so on. Blog post #4 in this series should be published in a few weeks, and will look at new capabilities coming soon in Windows Management Framework (WMF) and DSC, to surface the actual configuration health and drifts, as well as sample ways to work with them. In the meantime, you can work around the current limitations by using the CIM methods offered by LCM and build custom reports based on those results. And, if you are familiar with writing ASP.NET web applications and services, you can deploy you own endpoints to perform more than what the conformance endpoint provides.
Blog post series agenda
- Series agenda, Understanding the DSC conformance endpoint
- How to deploy a pull service endpoint and automate the configuration of the DSC nodes
- How to leverage the conformance endpoint deployed along with part of the pull service endpoint, to report on accurate configuration deployment and application (this post) : Are my DSC nodes downloading and applying the configurations without encountering any errors?
- Some options to determine if the nodes are conformant with the given configuration: Are my DSC nodes conformance with the configuration they are supposed to enforce?


