Is Power BI what you and your business needs?
By Ben Howard, MVP. Ben has over 20 years’ experience of implementing enterprise solutions such as MRPII, ERP, and latterly Microsoft’s EPM (Project and Project Server) solution. He has been a Microsoft Project MVP for the last 7 years, and is the author of Microsoft Project 2013 Plain & Simple .
Now that the year has well and truly begun, it’s time to take stock and investigate which technologies might begin to make a difference to you and your work in 2016. As a Project MVP, the technology stack that I have to keep an eye on has typically been fairly small, consisting of Microsoft Project and Project Server (and therefore SharePoint, Windows and SQL). As such, I can safely ignore most of the upgrades to the server applications (Exchange), developer tools (Visual Studio etc.) and desktop upgrades (Windows 10 etc.) which appear to me to make up the majority of Microsoft updates.
Anyway, back to the day job of implementing and deploying Project Server and Project Online. One of the key components of any successful deployment is reporting; typically, customers like a mixture of textual reports, and for senior management, a “dashboard”. Historically dashboards have been created using Excel because, lets face it, Excel is everywhere, it’s easily understood, and Excel charts can be rendered and displayed using Excel Services.
Creating Excel dashboards is no easy job
Creating Excel dashboards isn’t an easy job due to the additional skills required to write SQL select statements (on premise), use SharePoint and Excel Services. Latterly with Project Online, you also need the skills to consume and manipulate the OData feeds(to access the cloud data). This is a complex mixture of technologies for sure and hence creating dashboards is a highly skilled job, often performed by an external consultant. Dashboards don’t remain static forever, and change often during the first year of a Project Server/Project Online deployment (as the project management maturity of the organisation and consistency of the data both improve), which is fine if the organisation has retained the services of the consultant, but if not, then the dashboards often become outdated and unused.
Enter Power BI
This is where Power BI comes in. Unlike Excel, Power BI has been designed from the ground up to be a dashboard application that hooks into other data sources. The Power BI folks have hooked up with application vendors to make sure that Power BI can quickly and easily consume data from their applications by way of predefined “content packs”. From a Project Online perspective, this means all I have to do is open Power BI, point it at the Project Online Content Pack, supply the URL of my Project Online tenant and enter a set of credentials.
Building blocks
Before we get started, it’s worth understanding the building blocks of Power BI, of which there are three; dashboards, reports and datasets.
A dataset is something that you import or connectto. Use Power BI to bring all of your data together. See it all in one place and access it from all of your devices.
A reportis one or more pages of visualisations (charts and graphs). Reports can be created from scratch within Power BI, can be imported with dashboards that colleagues share with you, or can be created for you when you connect to datasets from Excel, Power BI Desktop, databases, and SaaS applications (including Project Online) and content packs.
A dashboardis something you create or something a colleague creates and shares with you. It is a single canvas that contains one or more tiles. Each tile displays a single visualisation that was created from the data in one of the underlying dataset(s).
Power BI Service and Desktop
You can interact with Power BI using a browser (aka Power BI Service), mobile client or desktop (aka Power BI Desktop) client.
To get started, login to the service using your O365 credentials on the Power BI site.
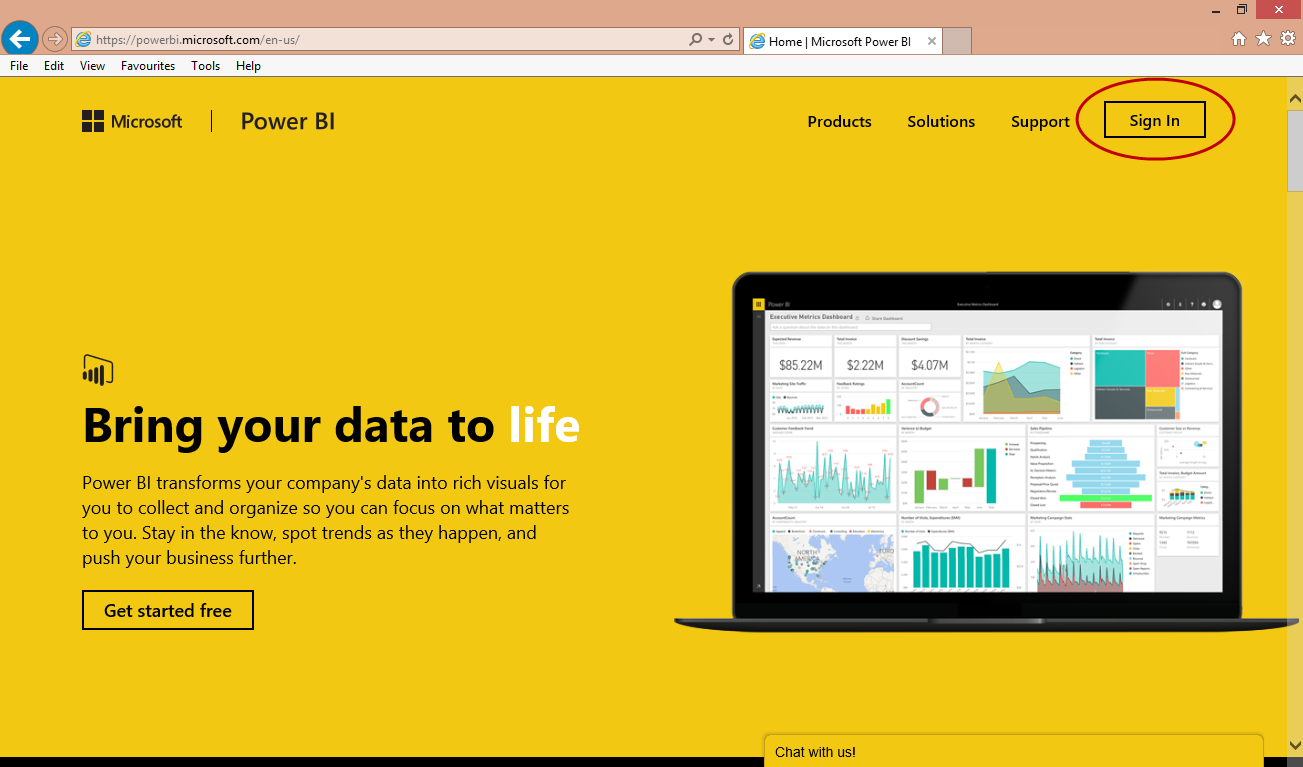
Figure 1 - Sign into Power BI
From within Services (1) select the Microsoft Project Online (2) content pack:
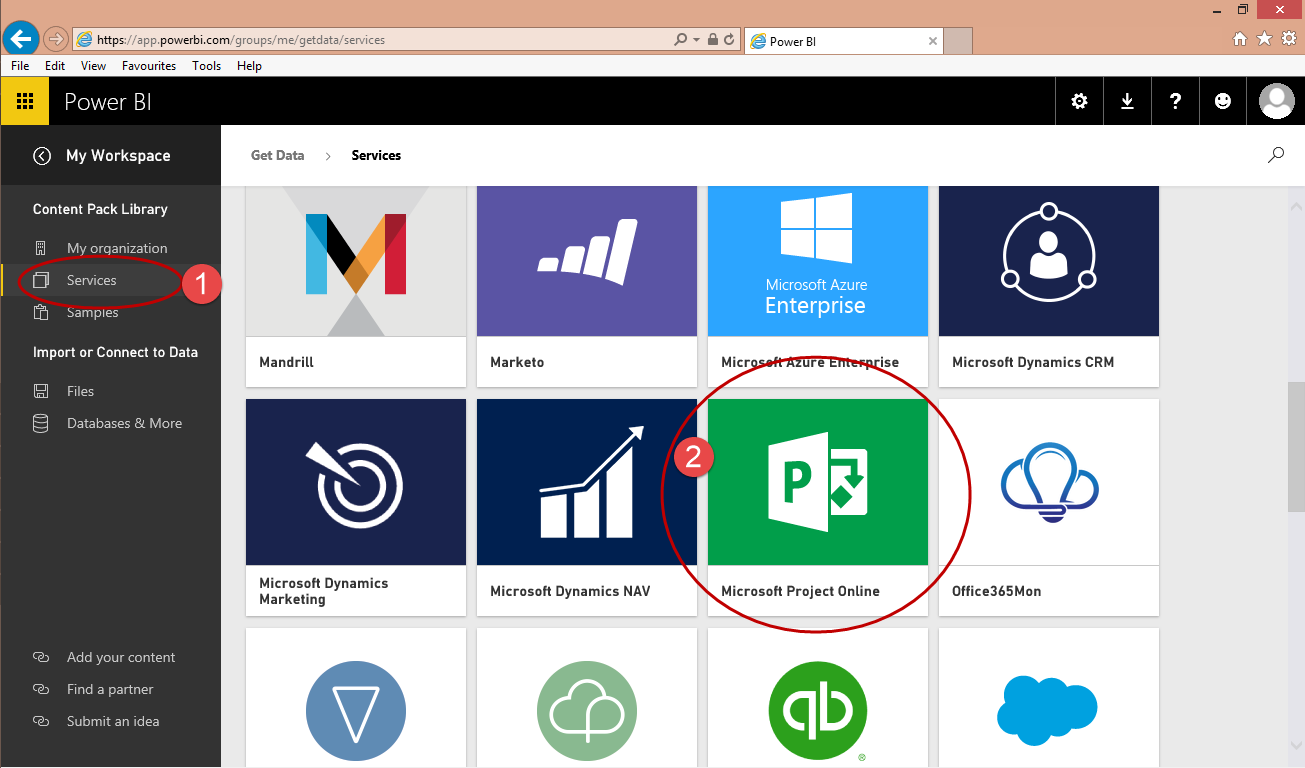
Figure 2 - Select the Project Online content pack
Enter the URL of your tenant (remember you might have several tenants associated with one account, hence the requirement to be explicit here):
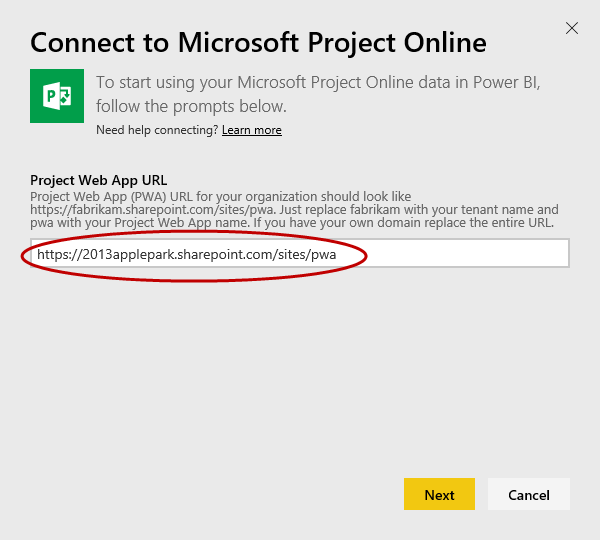
Figure 3 - Connecting the Content Pack to Project Online
At the authentication prompt, choose Auth2 and sign in using your Office 365 account. This checks that you have the right permissions for that tenant (you need to have Portfolio Vieweror above rights).
Once you’ve done this, you are then placed straight into the dashboard, and you can see that I have a new report and new dataset as well (denoted with the yellow asterisk). The other reports and datasets are existing ones I’ve created:
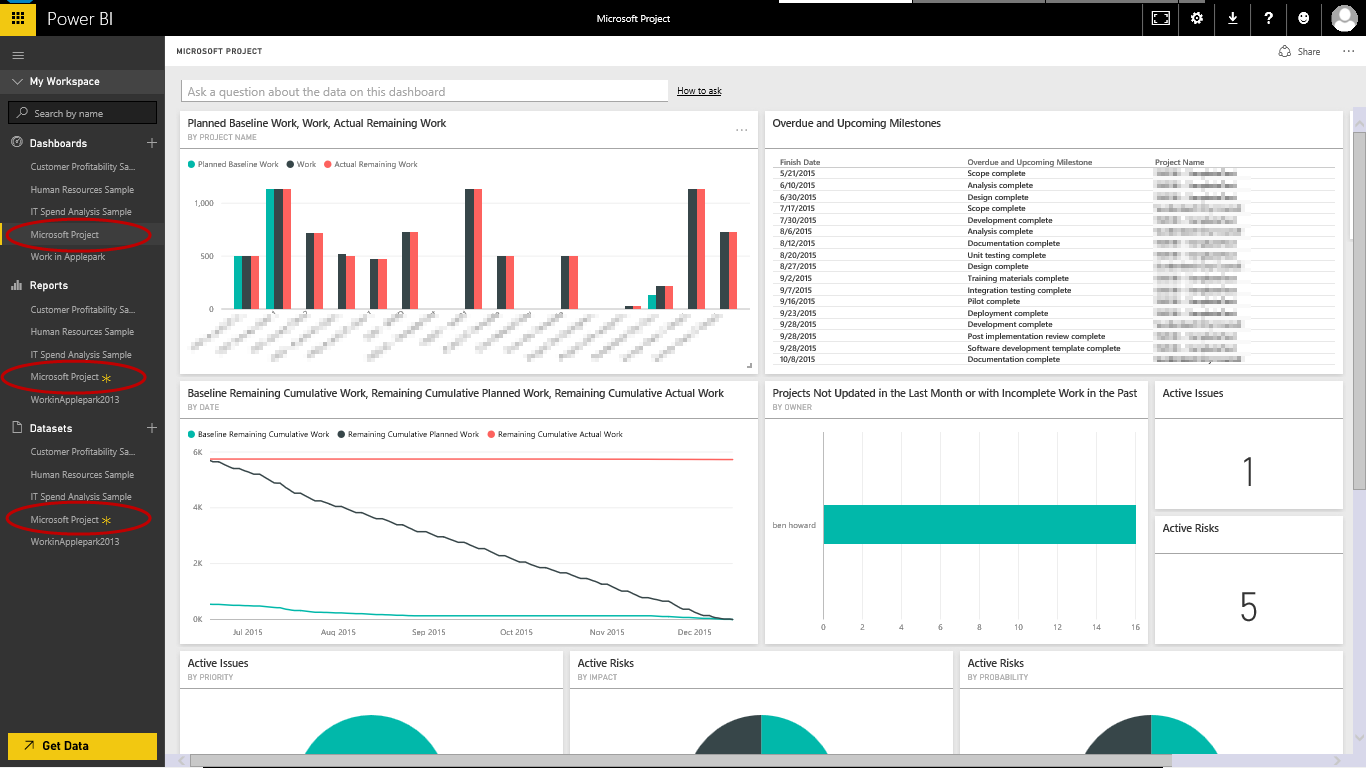
Figure 4 - Project Online Content Pack Dashboard
From this point on you can create your own dashboards and reports, using the predefined content pack.
Specify your own data source
However, if the content pack doesn’t do exactly what you need, then you can specify your own data source. You can do this by downloading and running the Power BI Desktop application: from there use the Get Data button to connect to your Project Web App site. One of the reports my customers consistently require is the “who’s doing what and when” report - this isn’t available in the Project Online content pack, so I need to create my own.
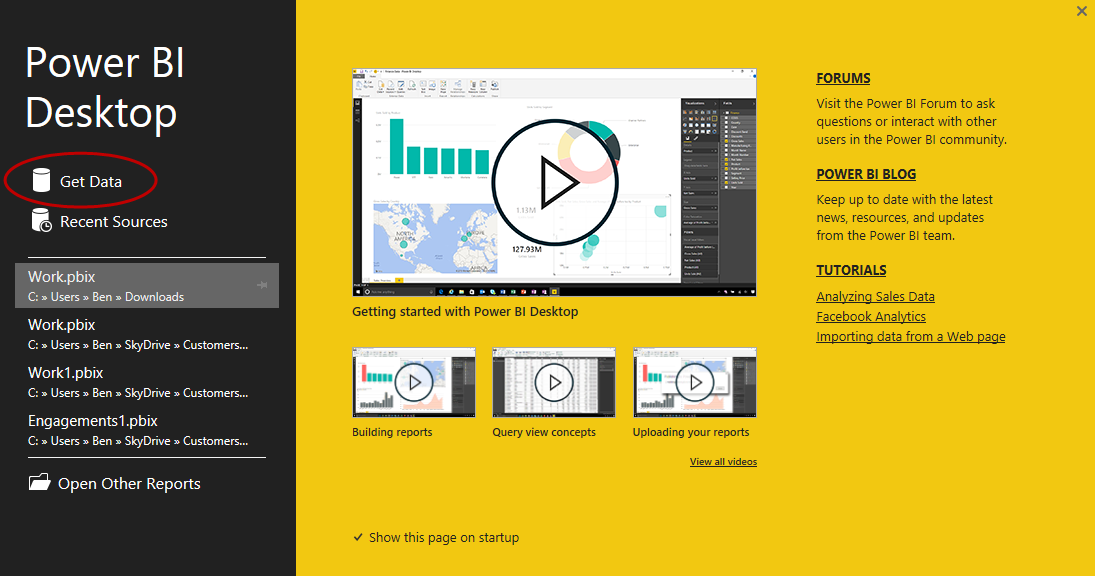
Figure 5 – Select Get Data from the Power BI Desktop
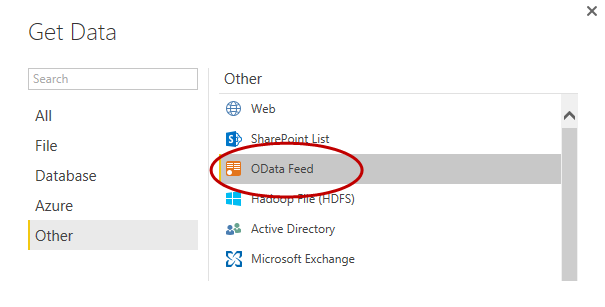
Figure 6 - Use the OData feed
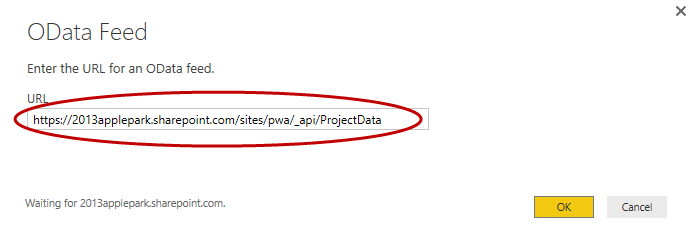
Figure 7 - the OData feed URL for the PWA tenant
The next screen is the Navigator screen, which prompts you to select the tables in the database. For resource information (timephased work etc), choose the AssignmentTimephasedDataSet and the Resource tables.
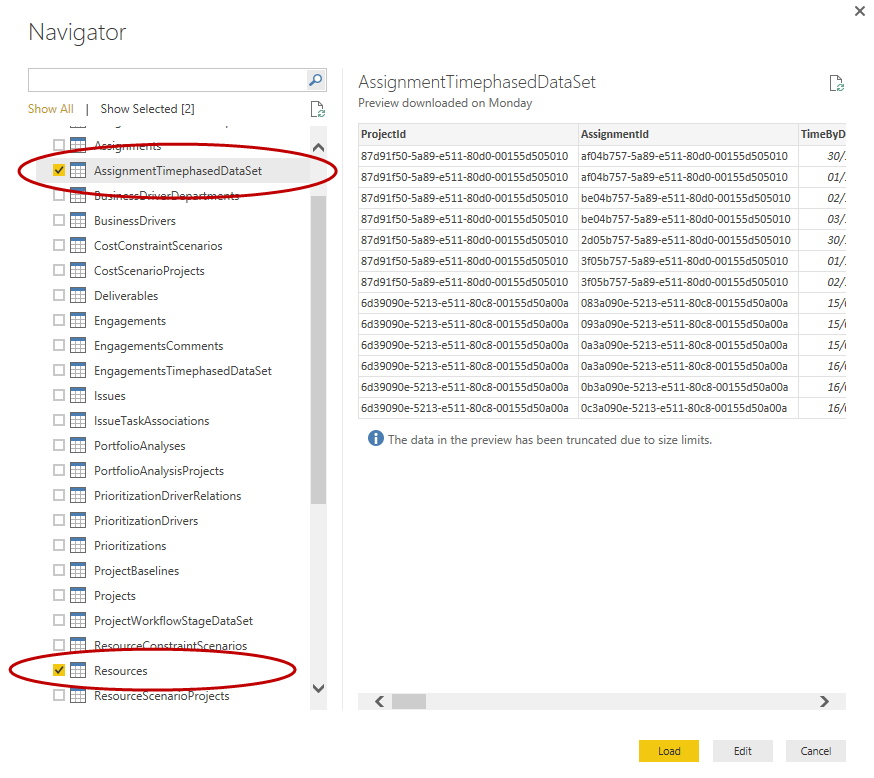
Figure 8 - Select the tables
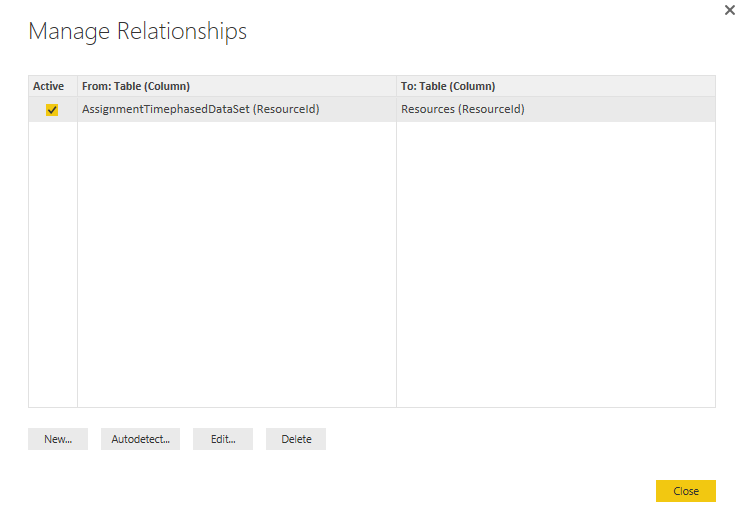
Manage relationships
Power BI is smart enough to create the relationship between the tables, in this instance using the ResourceID, but if you need to create your own relationships then you can use the Manage Relationships dialogue box.
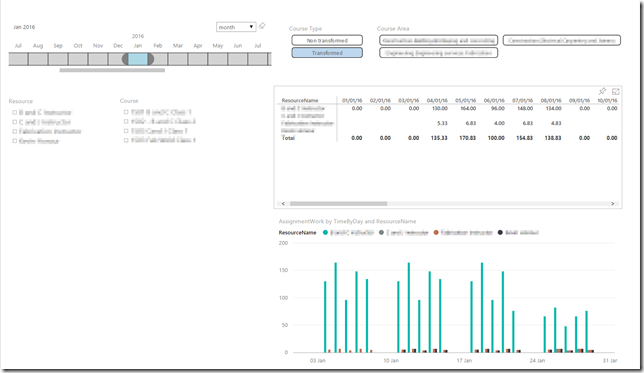
From here on in you can use Power BI to create the reports and dashboards you wish, in this case producing a report which shows me which resource is working on which project on which day – this is the kind of gold-dust report which typically has been really difficult to produce.
How can I get it?
If you’re using Office365, then Power BI is free, though of course there is a paid for version which isn’t expensive and gives some additional features.
For further information on Power BI, please review the Power BI website.