Getting Facebook trends with Data Explorer
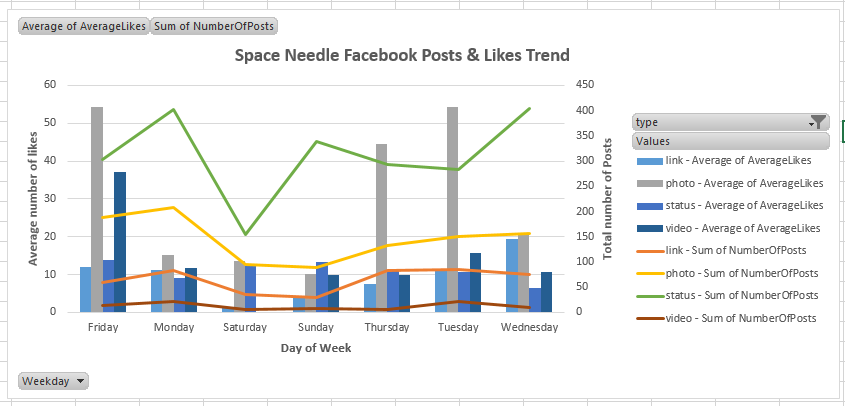
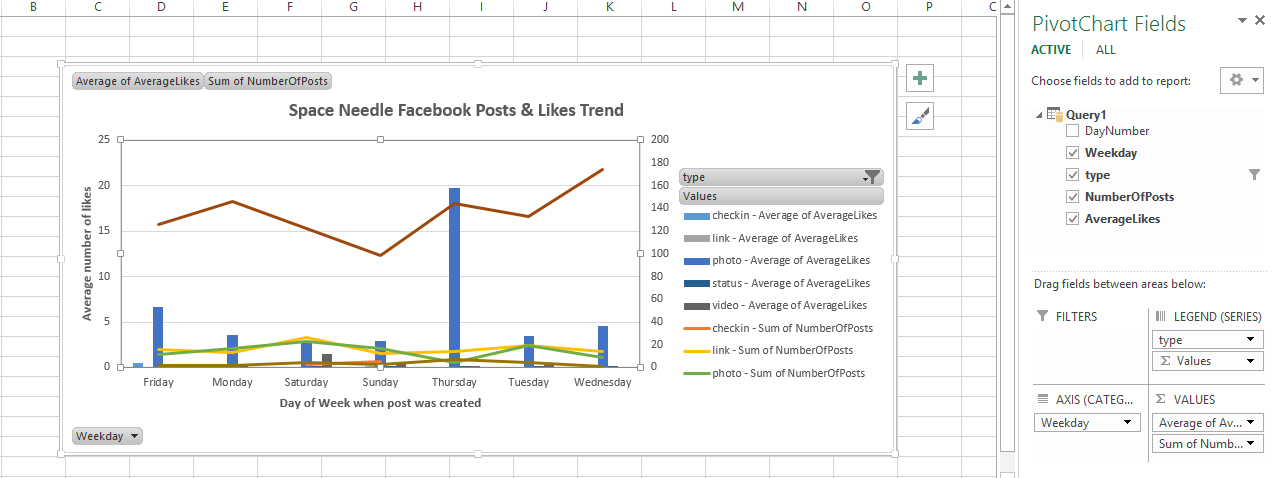
In previous post we looked at consuming CSV with Data Explorer. Even though CSVs are very common and a widely used data source, the example was kind of straight forward. Today, we would go social and connect to Facebook's graph API! I would get "Space Needle"' Facebook page's Status and Like trends from graph api and create the following chart in Excel. This kind of a trend might be interesting if a business wants to correlate its advertisement campaign with rise in its social media popularity.
This post would cover following features of Data Explorer
- Connecting to Facebook Graph API.
- Creating a Query using current Excel Workbook's data.
- Merging two DataExplorer queries.
- Using custom formulas.
- and finally Getting the above trend for your Facebook profile!
You can download the completed Excel sheet here (or get the complete Git repository from codeplex)
Now, lets create this Data Explorer query from scratch.
Facebook graph API contains data about all the objects in its network. Roughly every entity(like a person or a restaurant or a movie) is an object, there connections between these objects. For example if a person likes a movie, there would be a connection between that person's node and that movie's node. You can read about graph API here. Businesses have Facebook pages and it is interesting and valuable to look at social media popularity these days.
Data Explorer has the ability to connect to Facebook graph API.
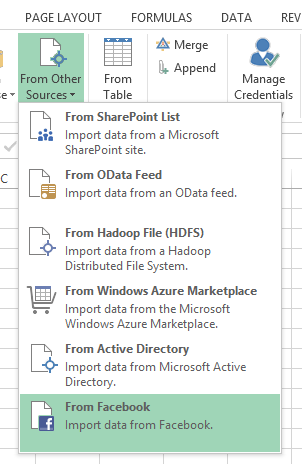
Step1: Add Facebook datasource by clicking on "From Other Sources --> From Facebook". Screenshot is below
After this, provide "SpaceNeedle" as the username. You can provide any valid facebook object name or id here. Roughly, you can do this by doing a search in Facebook.
Select "Feed" as the stream that you want to cover.
Next expand the likes column, below is how the screen looks like. Choose "likes.count"
After this hide all the columns except created_time, type,likes.count . (Previous post has details on how to hide columns)
Change type of "Created_time" column, just choose "auto-detect" DataExplorer would detect it to be a datetime data type.
Step2:- Inserting "Day of the Week" column using custom formula
I am interested in the looking at number of posts/likes Trend by Weekday. So I need a way to convert absolute date to day of the week.
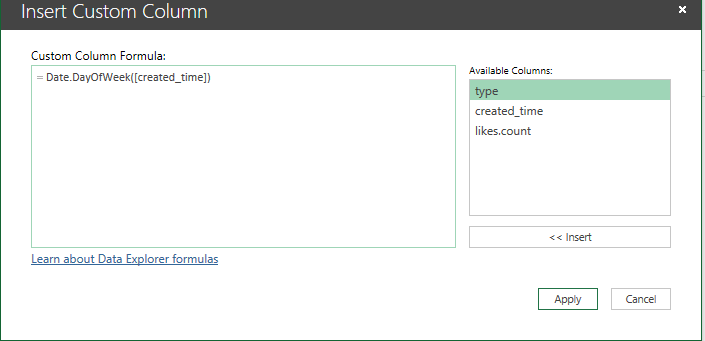
Data Explorer has a formula called "Date.DayOfWeek" . It takes a date and returns the day (0 being Sunday). You can read about Data Explorer library specification here, this documents the functions very well.
Right-click on any column and click "Insert Column --> Custom" . After this type in the "Date.DayOfWeek" formula. Below is how the screen looks like
Now I don't want to show "0" ,"1" etc for day of week, I would like to show "Sunday", "Monday" etc. We will update the query to do that in couple of steps.
Change name of this query to something meaningful. I have renamed it to "SpaceNeedleFacebook".
Step3:- Adding current excel sheet as a data explorer query.
You would want to add current excel sheet as a Data Explorer for variety of reasons. One of them could be to hande-enter few data points.
In this case, I have manually created a "DayOfWeekNumber" to "Weekday string". "From Table" option in Data Explorer lets you add current Excel sheet. Below is a screenshot
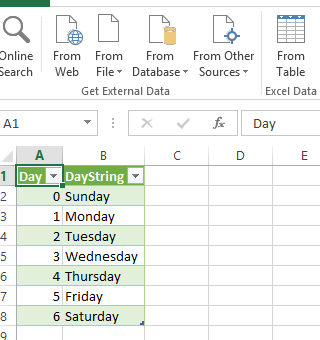
I have renamed the query to DayNumberToDayStringMapping.
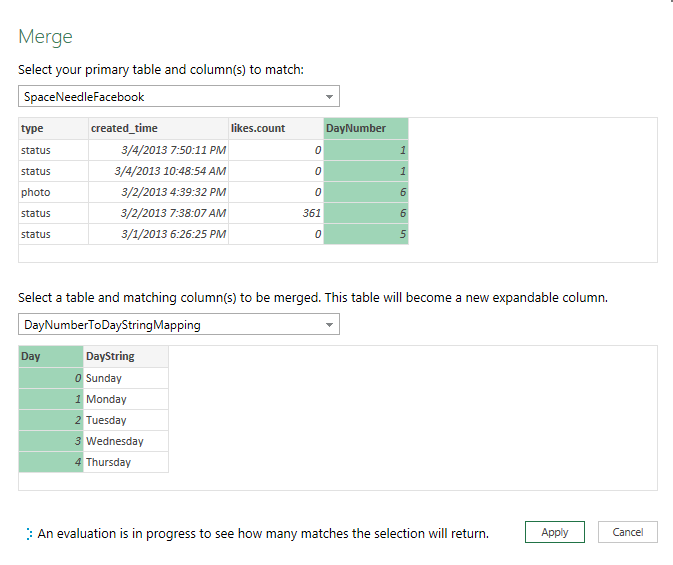
Step4:- Merging two tables in Data Explorer.
I can simply merge "DayNumberToDayStringMapping" query and "SpaceNeedleFacebook" query. Merging roughly combines two tables based on one or more columns.
Below is a screenshot that merges our two queries on "Day" column.
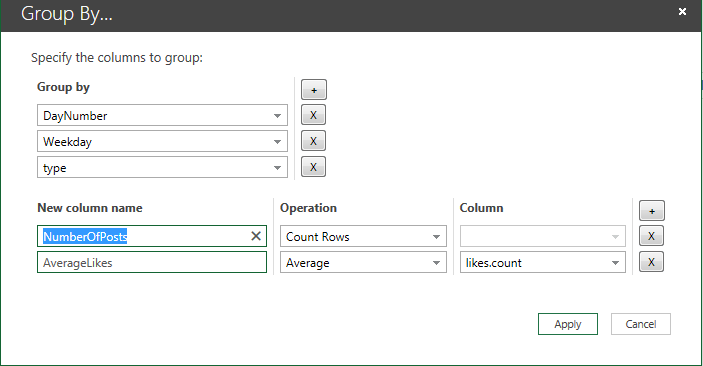
Step5:- Group by "Weekday and Type". I want to find the total number of posts done and average number of likes on each day of the week.
Right-click on any column and click "Group by". Then choose the columns you want to group by. Below is the screen shot
Click "Done" and wait for the data to be loaded in Excel sheet. It might take few seconds because it is getting all all statuses from Facebook graph API.
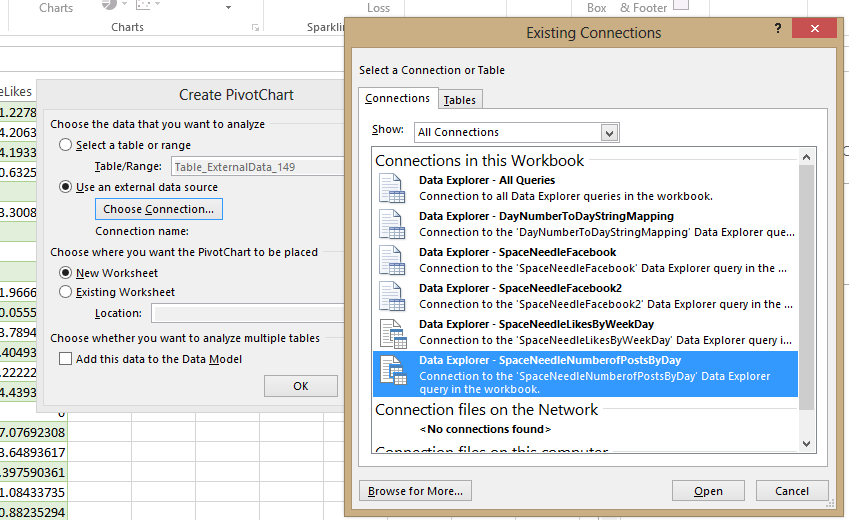
Step6: Create a Pivot-chart with this data. Every Data Explorer query is an external connection in Excel. You can create a pivot-chart using that connection.
From then on its regular Excel pivot-chart. Below is a screenshot to initiate the pivot-chart
Below is the final output, we are done! That's Space Needle Facebook page's trend. Photos posted on thursday receives more likes (May be because of increased user activity on Weekends)
Step7:- Getting these trends for your facebook profile. This one is simple, in step one provide username as "me" instead of "Space Needle".
Once again you can get the completed excel sheet from codeplex.
Enjoy!