Build PowerBI Real Time Dashboards through Streaming Set with Python
PowerBI supports streaming dataset through an API that can be used to constantly push data to the service for real-time refresh. This post outlines the steps to accomplish it with Python script.
Create a StreamDataSet in PowerBI
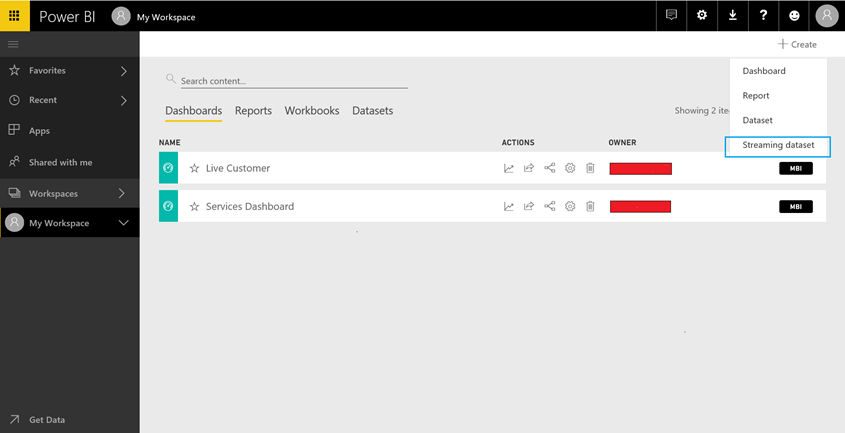
In your workspace, Click on " + Create" and choose "Streaming dataset"
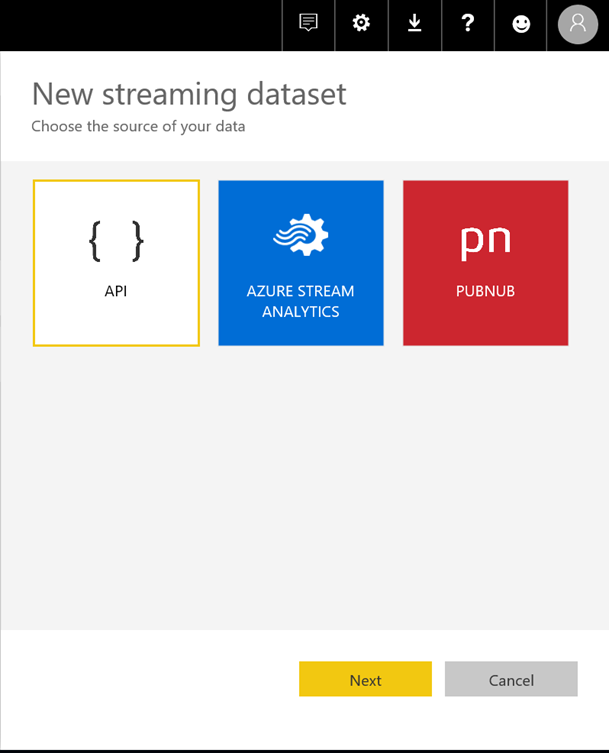
Once you choose "streaming dataset" option, pick "API" streaming option since we will use this API to populate data from Python
Once you click Next, enter the data set name and the values that you need to post on the API. These values will then have to be used as data set on the dashboard.
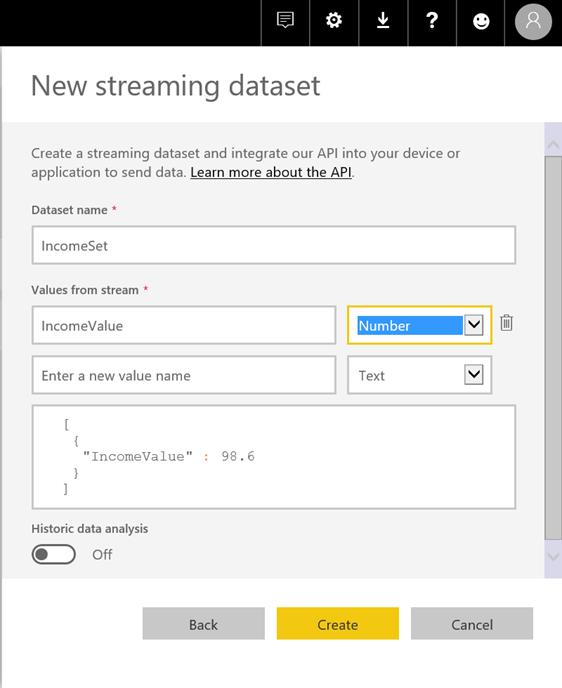
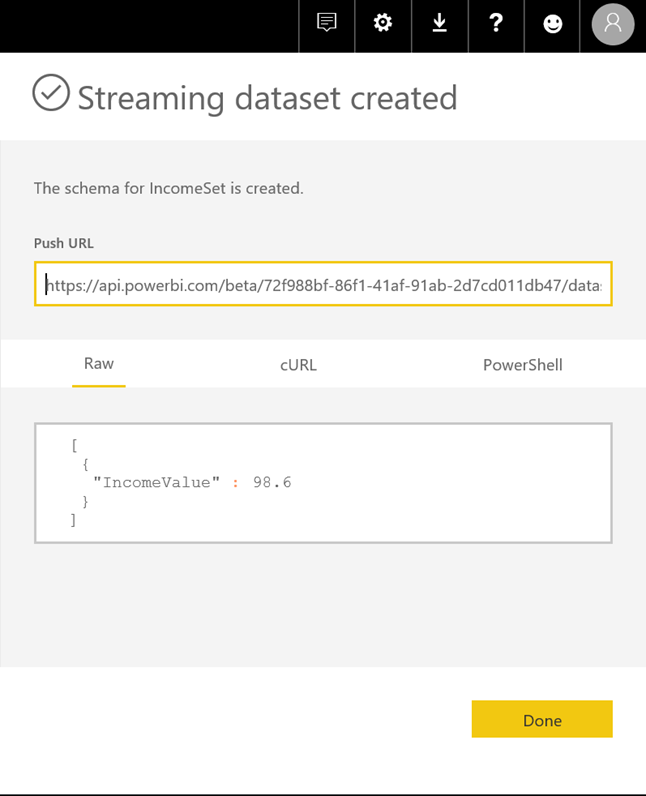
Once you click on the create button, the service will create a Push URL that will be the API to push the data to. Copy the PUSH URL to the python script.
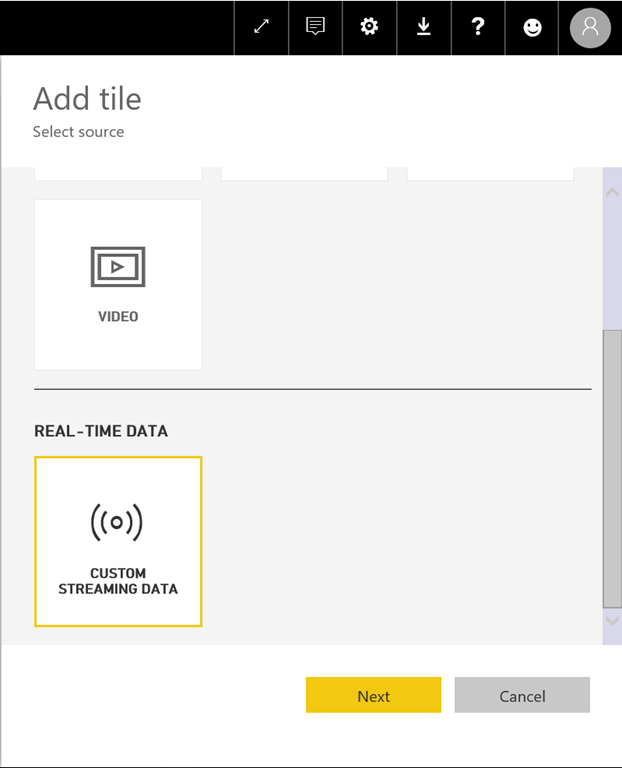
Then create a Dashboard and Add a tile and choose 'Custom streaming data'. You will then see the streaming data sets that was created in the previous step. You can add the elements that was created as part of the steam set.
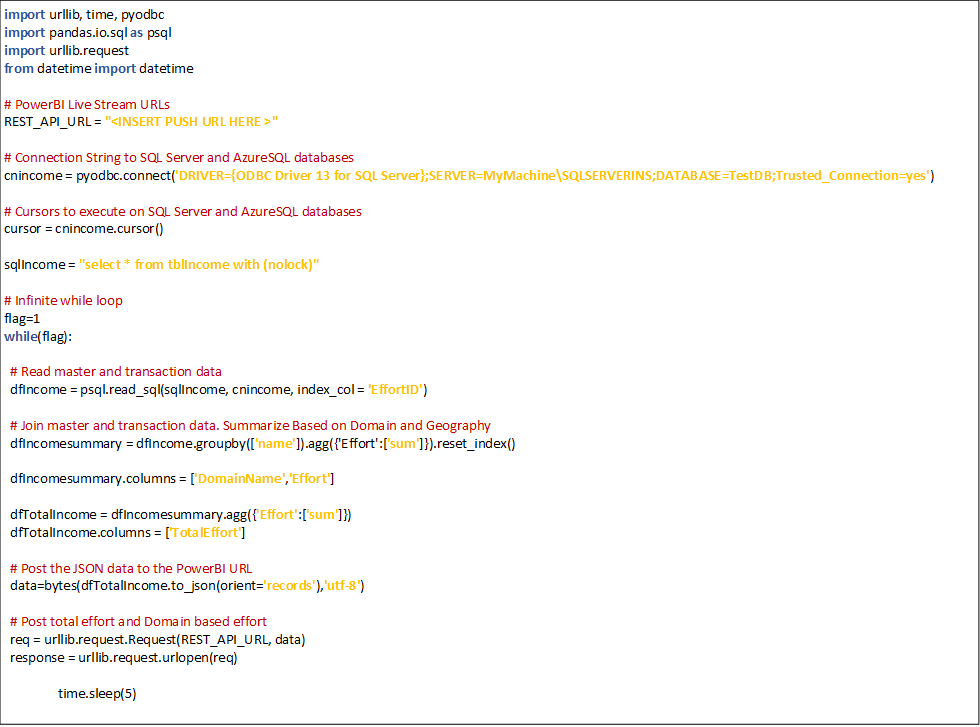
Once the dashboard Is created, copy the PUSH URL in the script below. The below script reads data from a SQL Server table at regular interval and aggregates and generates the sum of the Income value. The generated totalincome is converted to a JSON format required for the Push URL and then post it to the API.
The script runs in an infinite loop, by reading data and pushing data into the PowerBI streaming set. In a real world scenario, the data read from the DB will have be incremental either based on date, ID or other relevant column.