Wizard to Create PowerShell Workflows in OpsMgr to Collect “Type=Event” Data for OMS
This post features a new sample management pack that provides a wizard to allow the user to create PowerShell-based script rules to collect custom data to be stored as event-typed data (Type=Event) in OMS, using a template in the Operations Console in System Center Operations Manager 2012.
The custom event data collected can then be queried/analysed/correlated/monitored/presented in OMS via its intuitive and powerful log search UI, custom fields feature and customizable dashboard capabilities.
I have previously blogged about how we can collect “Type=Event” data from text log files by creating a custom management pack with the right series of modules, PowerShell script and references, to create a PowerShell-based event collection workflow that writes to OMS. The whole authoring process of the management pack could take hours.
Now, with a predefined wizard available, it should only take minutes to create these types of workflows with the UI experience in the Operations Console in System Center Operations Manager 2012.
The sample management pack with the wizard can now be downloaded from the TechNet Gallery.
The “Sample PowerShell PowerShell Type Base Library” management packis included as a separate file in the download package. This is because the elements in the sample management pack references module types defined in the base library management pack. Note that if the management pack bundle with the wizards to create different types of Performance Collection rules was imported previously, the “Sample PowerShell PowerShell Type Base Library”management pack does not need to be imported again
Importing this sample management pack will allow a new PowerShell Script Event Collection Rule Type – PowerShell Script (Event – OMS Bound) - to appear under the Collection Rules\Probe Based folder on the “Select a Rule Type” wizard page as follows:
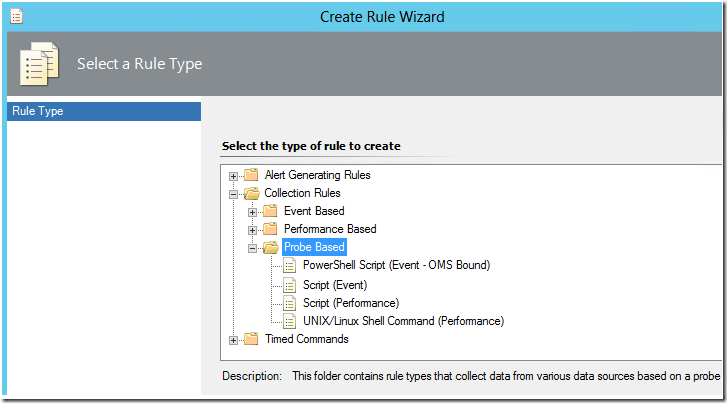
This PowerShell Script rule type comes with a wizard to create custom OpsMgr rules for collecting PowerShell script data as event data and sending it to OMS (Operations Management Suite).
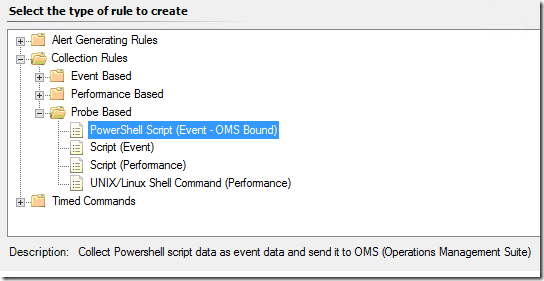
Here are the steps on how to create and configure a custom event collection rule based on this rule type using it’s specific wizard, and enabling it to send it’s collected data to a Microsoft Operations Management Suite workspace:
After importing the management pack, go to the Authoring workspace of the Operations Console first.
Right-click on the Rules View under Management Pack Objects, and select the Create a new rule… option.

On the Rule Type page, select the PowerShell Script (Event – OMS Bound) rule type under the Collection Rules\Probe Based folder, and specify the management pack to save the custom rule configuration.
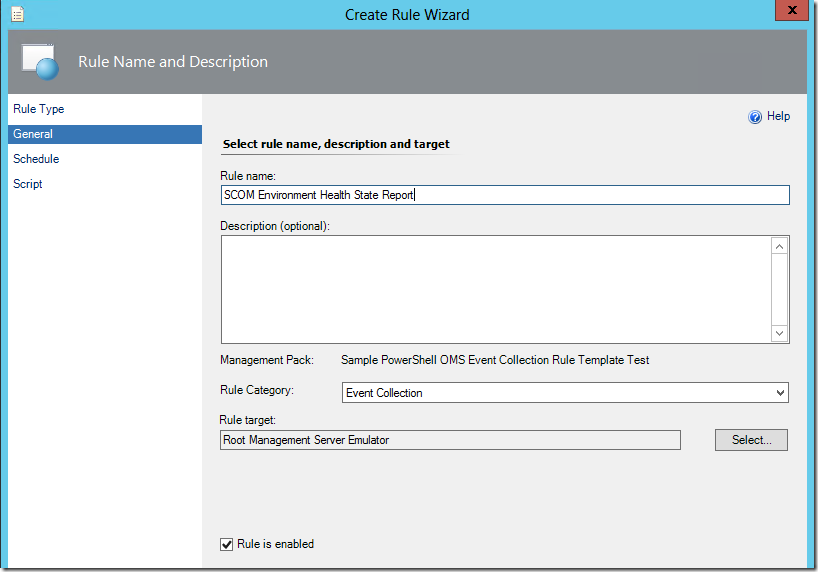
On the General Page, give the custom collection rule a meaningful name, select Event Collection from the drop-down list, and select a target for the rule.
Important Notes:
Make sure to be EXTRA CAUTIOUS on selecting the target for the collection rule as the rule will run on all instances of the targeted class to collect the script data to be sent to the OMS endpoint.
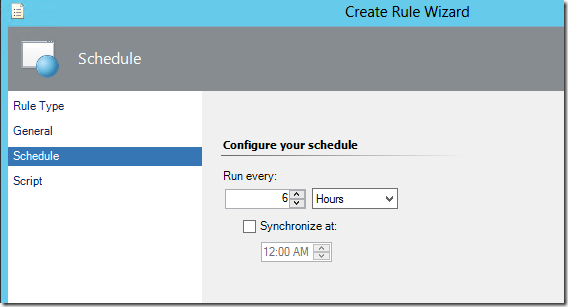
In this example, the RMS Emulator class is used as it ensures that the rule runs on a single management server that is assuming the RMS Emulator role.On the Schedule page, configure the sample interval for the OMS Event collection rule:
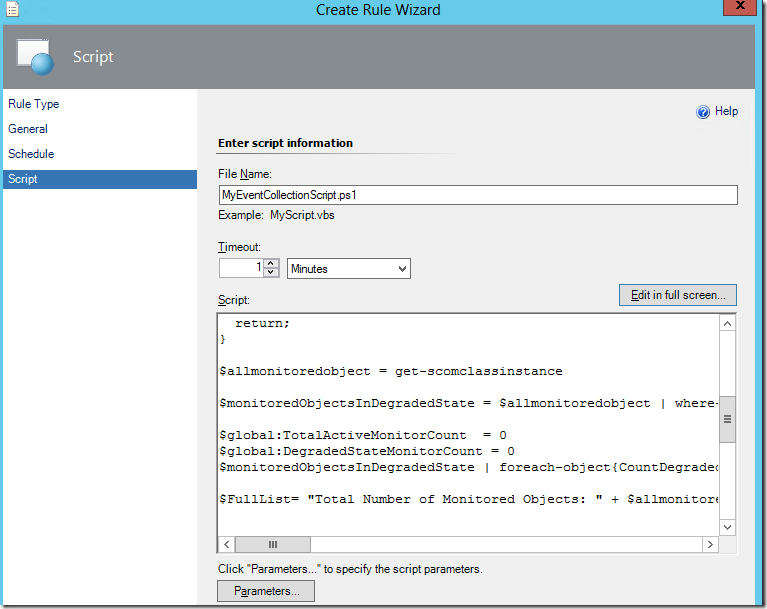
On the Script page, enter the collection script (in PowerShell) and its timeout threshold and input parameters.
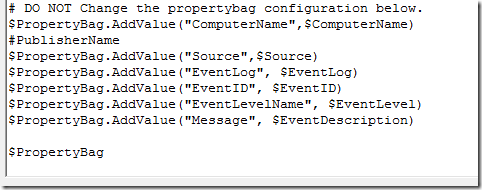
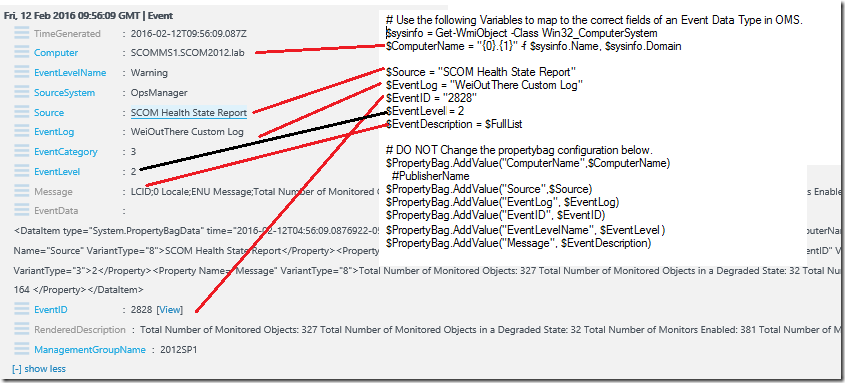
Note that the mapping between the variables, the propertybag properties and the event data type properties in OMS has been defined. All that is left to do is to assign the right values to the variables for the event data to show up correctly in OMS.

The PowerShell script used in this instance retrieves the total number of
1. monitored objects,
2. objects in a degraded state (Warning or Critical),
3. enabled monitors, and
4. monitors in a degraded state (Warning or Critical),
in the current OpsMgr 2012 Management Group. The result is then appended to a full string and assigned to the Message or Description field of the event data in OMS.param($Arguments)
#Enter a script that outputs the required data to generate the event using a property bag
# Define Com Object:
$API = new-object -comObject "MOM.ScriptAPI"
$PropertyBag = $API.CreatePropertyBag()################## Main Script Area Start $newline = "`r`n"
$FullList=""Import-Module OperationsManager #Recursive function to count total number of enabled monitors and total number of monitors in a degraded state.
function CountDegradedStateMonitors($monitor)
{
if ( $monitor.Item.HealthState -eq "Error" -or $monitor.Item.HealthState -eq "Warning")
{$global:DegradedStateMonitorCount++}
if ( $monitor.Item.HealthState -ne "Uninitialized")
{$global:TotalActiveMonitorCount++}
$monitor.ChildNodes | foreach-object{ CountDegradedStateMonitors( $_ ) }
return;
}$allmonitoredobject = get-scomclassinstance
$monitoredObjectsInDegradedState = $allmonitoredobject | where-object{$_.HealthState -eq "Error" -or $_.HealthState -eq "Warning"}
$global:TotalActiveMonitorCount = 0
$global:DegradedStateMonitorCount = 0
$monitoredObjectsInDegradedState | foreach-object{CountDegradedStateMonitors($_.GetMonitoringStateHierarchy())}$FullList= "Total Number of Monitored Objects: " + $allmonitoredobject.count + $newline + "Total Number of Monitored Objects in a Degraded State: " + $monitoredObjectsInDegradedState.Count + $newline + "Total Number of Monitors Enabled: " + $global:TotalActiveMonitorCount + $newline + "Total Number of Monitors in a Degraded State: " + $global:DegradedStateMonitorCount + $newline
################## Main Script Area End
# Use the following Variables to map to the correct fields of an Event Data Type in OMS.
$ComputerName = ""
$Source = "SCOM Health State Report"
$EventLog = "WeiOutThere Custom Log"
$EventID = "2828"
$EventDescription = $FullList#Event Level MUST be a numerical value: 2 (=Error), 3 (=Warning), 4 (=Information)
$EventLevel = 4# DO NOT Change the propertybag configuration below.
$PropertyBag.AddValue("ComputerName",$ComputerName)
#PublisherName
$PropertyBag.AddValue("Source",$Source)
$PropertyBag.AddValue("EventLog", $EventLog)
$PropertyBag.AddValue("EventID", $EventID)
$PropertyBag.AddValue("EventLevelName", $EventLevel)
$PropertyBag.AddValue("Message", $EventDescription)$PropertyBag
Refer to the following posts on how to specify Script Parameters via the Parameters option on Script page:
New Sample Wizard to Create PowerShell Monitors in the Ops Console
Using a Scriptblock in a PowerShell Monitor Created in the Ops ConsoleCompleting the last page of the wizard and clicking the Create button will create the collection rule. Depending on which class was specified as a target during rule creation, the collection rule can be located in the Authoring workspace under the Rules page.
In this example, the target class used is the RMS Emulator.
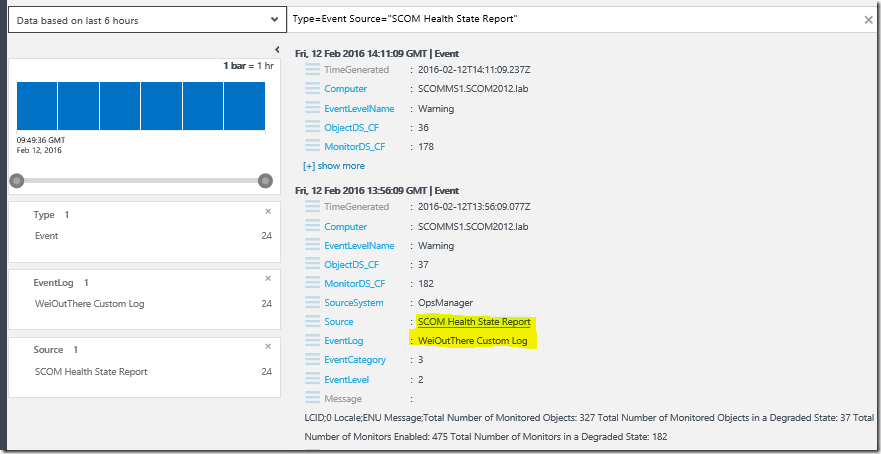
If everything is configured correctly, after a few minutes, the custom event data should appear in the connected OMS Workspace depending on how frequent the sample interval is configured for the collection rule:
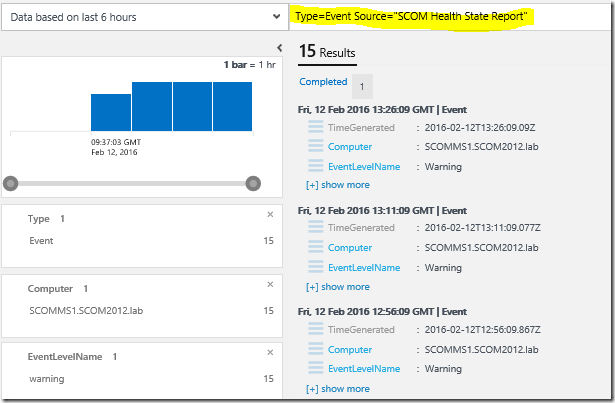
Expanding an event and showing the relationship between the variables used in the collection rule script, and the properties of the event data in OMS:
The custom event data collected can be further extended in OMS with the Custom Field feature.
For more information on Custom Fields, please refer to Evan’s blog post on the OMS Custom Fields Feature at the System Center: Operations Manager Engineering Blog.”Custom Fields will allow users to create a new searchable field from their data that is already within OMS.”
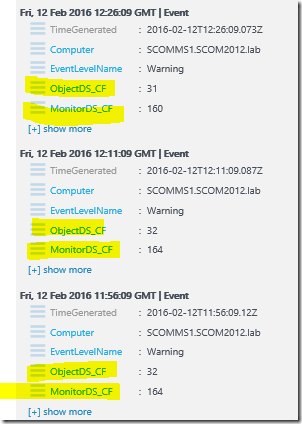
In this example, if we want to create new searchable fields for the Total Number of Monitored Objects in a Degraded State, and the Total Number of Monitors in a Degraded State from the Message/Description property of the collected event, it can be achieved within a few clicks in the OMS Workspace !

After extracting the fields, naming the field title and saving the extraction, the custom fields should appear with the right values for the custom events going forward as follows:
Thank you for your support !