Visual Studio 2010 Profiler
Some of you might be wondering what is the use of a profiler. I am a good programmer and my application is running without any trouble. Why shall I use the profiler?
Think of a scenario where you have developed an application which is going to be deployed on a production server and several hundred of users are going to use it. How can you verify that the application will be working perfectly as expected?
Take another scenario where some of the users are complaining about the application slow performance. How can you identify and correct the performance bottleneck? Which function is causing the issue? Which line to correct?
Visual Studio profiler is an answer for such scenarios. To know more about profiler you may need to read the MSDN link.
This walkthrough is an effort to present some important features of the profiler, introduced in Visual Studio 2010, which can help the developers/testers improve application performance.
Brief Summary of features:
- No need to setup environment variables for "Attach Profiler to Process".
- Start Performance Analysis easily.
- Profiling In Progress - do simple operations while profiling is done.
- Profiler Summary Page - get an overview of the results.
- Function Details View - peep into the code and get function level details with the profiler.
- Profiler Guidance Rule - remove bottleneck by analyzing the code and get expert advice.
Attach Profiler to Process:
You can now attach profiler to an already running managed application. With earlier version, there was a need to setup environment variables correctly. This is not a requirement in Visual Studio 2010.
- Run the managed application.
- Attach the process. (Analyze>Profiler>Attach).
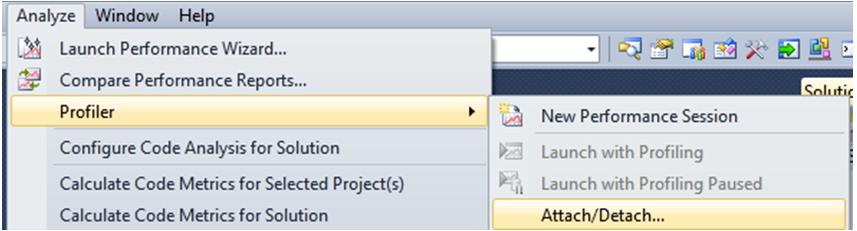
- Select the process from the "Attach Profiler to Process" dialog box.
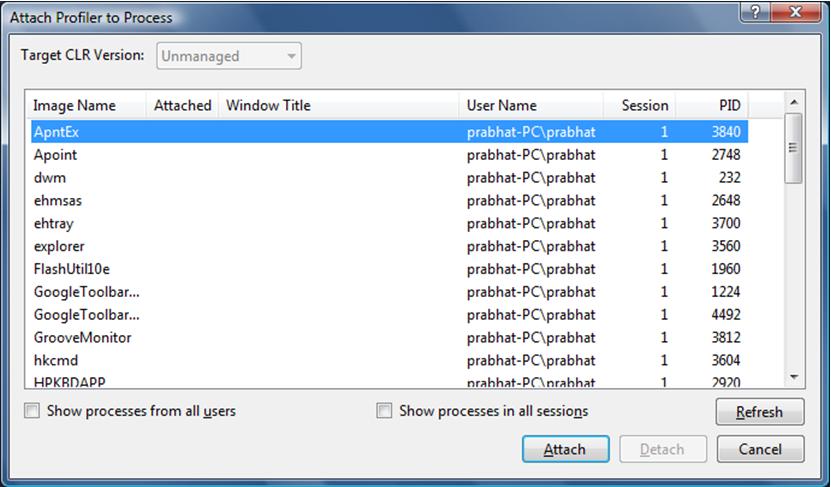
You can also select the CLR target version for the managed process.
- When you are done, detach it.
[You can also use the /ATTACH:PID option with the vsperfcmd command]
Start Performance Analysis
With this new option, you can start profiling the application with minimal effort. Here are the steps to start a performance analysis session from the UI:
1. Open a solution in Visual Studio 2010.
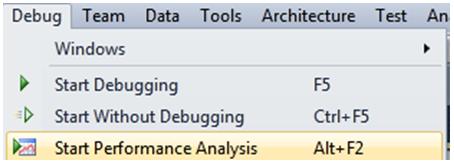
2. Click Debug>Start Performance Analysis :
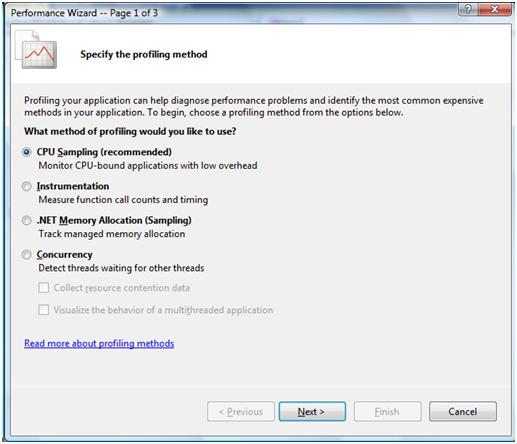
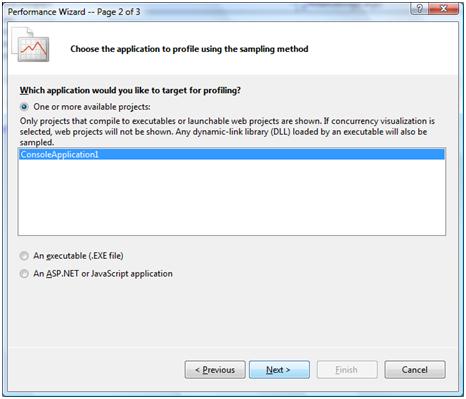
3. Select the Profiling method :
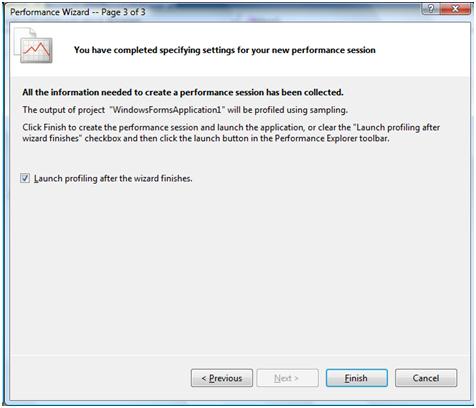
4. Select the project and launch the profiler along with the application :
Alternatively, you can also use the keyboard shortcut key ALT+F2 to run the profiler. This will invoke the performance wizard.
Profiling in progress
Profiling the application can take a long time and during this period a spin control is displayed.
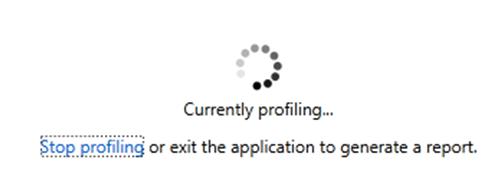
Here you get the option to stop profiling. This may be needed if the application has already reached at the stage which needs to be examined.
Profiler Summary Page
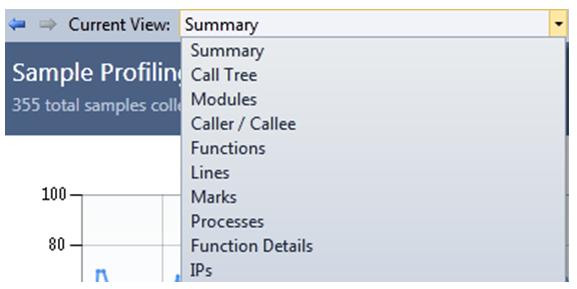
The report can be viewed in different forms. The default view is "Summary View".
The profiler summary page makes it easy to analyze the performance of the application. It contains the following important sections which helps diagnose the performance bottlenecks in the application. Profiling a simple VC# console application which contains a nested for-loop provides the following summary page:
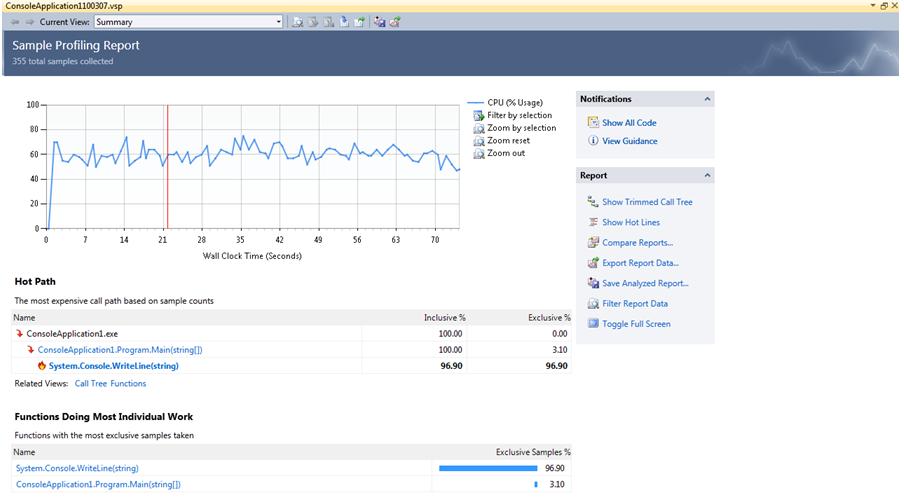
The heading of the report lists how many samples were collected during the profiler session. In this example, there are 355 samples collected.
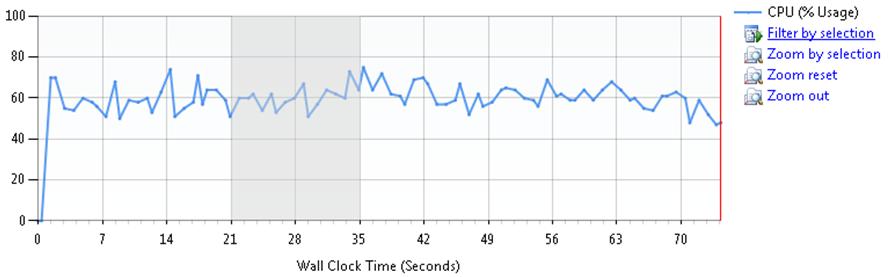
Highlight a region in the graph and click the link "Filter by selection".
Right to the view selection box, there is a filter toolbar which contains different filtering options. Alternatively, filter criteria can be set by manually typing the timestamp values.
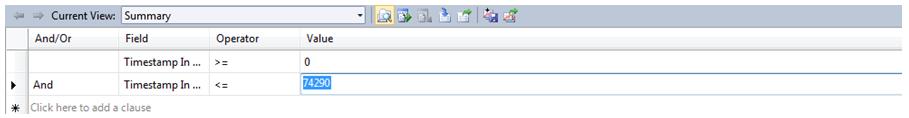
"Show Filter" is the first button which shows the filter criteria selection box. You can execute, import and export the reports also.
Once the criteria are specified, use the "Execute Filter" (second button) to show the data based on the specified timeline.
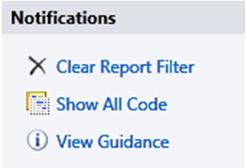
The filter can be reset by clicking the option in the Clear Report Filter in the Notifications section.
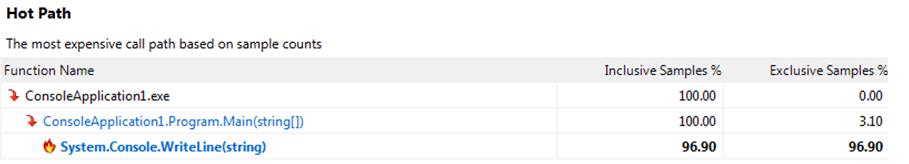
Hot Path
The summary page also shows the call path that is most expensive.
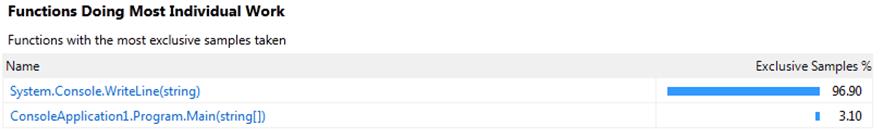
Functions doing most individual work
This section lists all the expensive functions in the order of their exclusive samples collected during the profiling.
Function Details
Clicking the function will direct to the respective Function Details. Following is the function detail window for WriteLine(string) function.
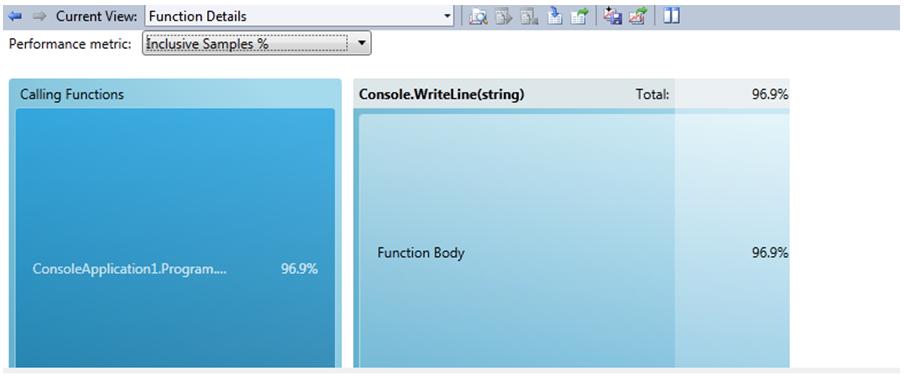
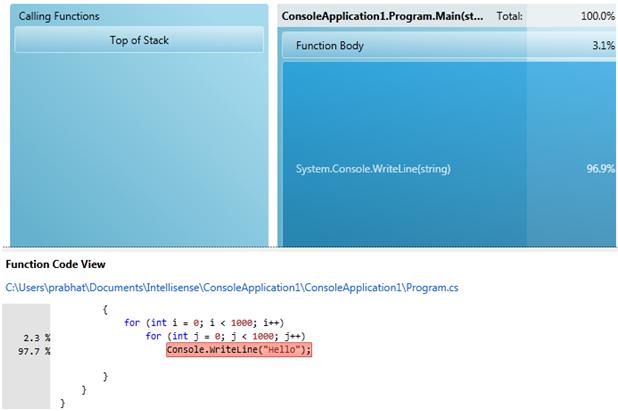
The blue-boxes are click-able. Clicking the function will open-up the function code view:
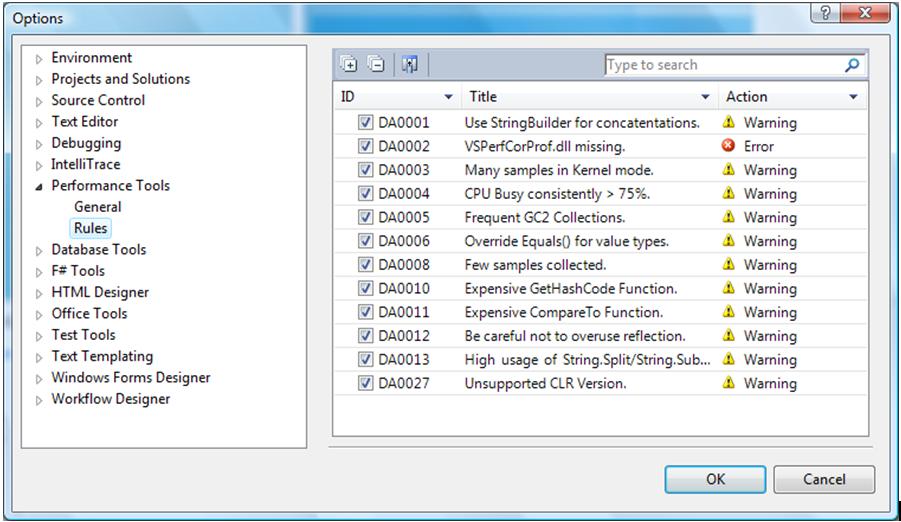
Profile Guidance Rule
Profile-guidance rules help to provide guidance to improve performance of the application. Go to Tools>Options>Performance Tools>Rules. These rules can be configured depending on the need.
In the example, clicking the View Guidance under the Notifications section shows the following warning:

Summary
It is worth investing time running Visual Studio 2010 Profiler to ensure high productivity and improved performance.