Monitor a single Azure Stack HCI cluster with Insights
Applies to: Azure Stack HCI, versions 22H2 and 21H2
This article explains how to use Insights to monitor a single Azure Stack HCI cluster. For multiple Azure Stack HCI clusters, see Monitor multiple Azure Stack HCI clusters with Insights.
Insights is a feature of Azure Monitor that quickly gets you started monitoring your Azure Stack HCI cluster. You can view key metrics, health, and usage information regarding cluster, servers, virtual machines, and storage.
Important
If you registered your Azure Stack HCI cluster and configured Insights before November 2023, certain features that use Azure Monitor Agent (AMA), such as Arc for Servers, VM Insights, Defender for Cloud, or Sentinel might not collect logs and event data correctly. For troubleshooting guidance, see the Troubleshoot clusters registered before November 2023 section.
Benefits
Insights for Azure Stack HCI offers the following benefits:
Managed by Azure. Insights is managed by Azure and accessed through the Azure portal, ensuring it's always up to date. There's no need for database or special software setup.
Scalability. Insights is capable of loading over 400 cluster information sets across multiple subscriptions simultaneously. There are no limitations on cluster, domain, or physical location.
Customizability. The Insight's experience is built on top of Azure Monitor workbook templates. This allows you to change the views and queries, modify or set thresholds that align with your specific limits, and then save these customizations into a workbook. You can then pin charts in the workbooks to the Azure dashboards.
Configure Insights for Azure Stack HCI
The prerequisites and settings for using Insights vary depending on the version of Azure Stack HCI you have. Select one of the following tabs for instructions on how to use Insights on your specific version of Azure Stack HCI.
The Insights feature in Azure Stack HCI, versions 22H2 and later, uses AMA, which offers significant advantages compared to the legacy Microsoft Monitoring Agent (MMA) used in Azure Stack HCI, version 21H2 and earlier. These advantages include improved speed, enhanced security, and superior performance. You can onboard new nodes to AMA or migrate your existing nodes from the Legacy agent to AMA.
We recommend that you upgrade your Azure Stack HCI system to version 22H2 or later to take advantage of the Insights experience with AMA.
Starting with the May 2023 cumulative update for Azure Stack HCI, version 22H2, you can monitor on-premises Azure Stack HCI systems with Insights for Azure Stack HCI.
Prerequisites
Here are the prerequisites for using Insights for Azure Stack HCI:
Azure Stack HCI cluster should be registered with Azure and Arc-enabled. If you registered your cluster on or after June 15, 2021, this happens by default. Otherwise, you must enable Azure Arc integration.
The cluster must have Azure Stack HCI, version 22H2 and the May 2023 cumulative update or later installed.
The managed identity for the Azure resource must be enabled. For more information, see Enabled enhanced management.
Enable Insights
Enabling Insights helps you monitor all Azure Stack HCI clusters currently associated with the Log Analytics workspace by providing useful health metrics. Insights installs the Azure Monitor Agent and helps you to configure data collection rules (DCRs) for monitoring your Azure Stack HCI cluster.
To enable this capability from the Azure portal, follow these steps:
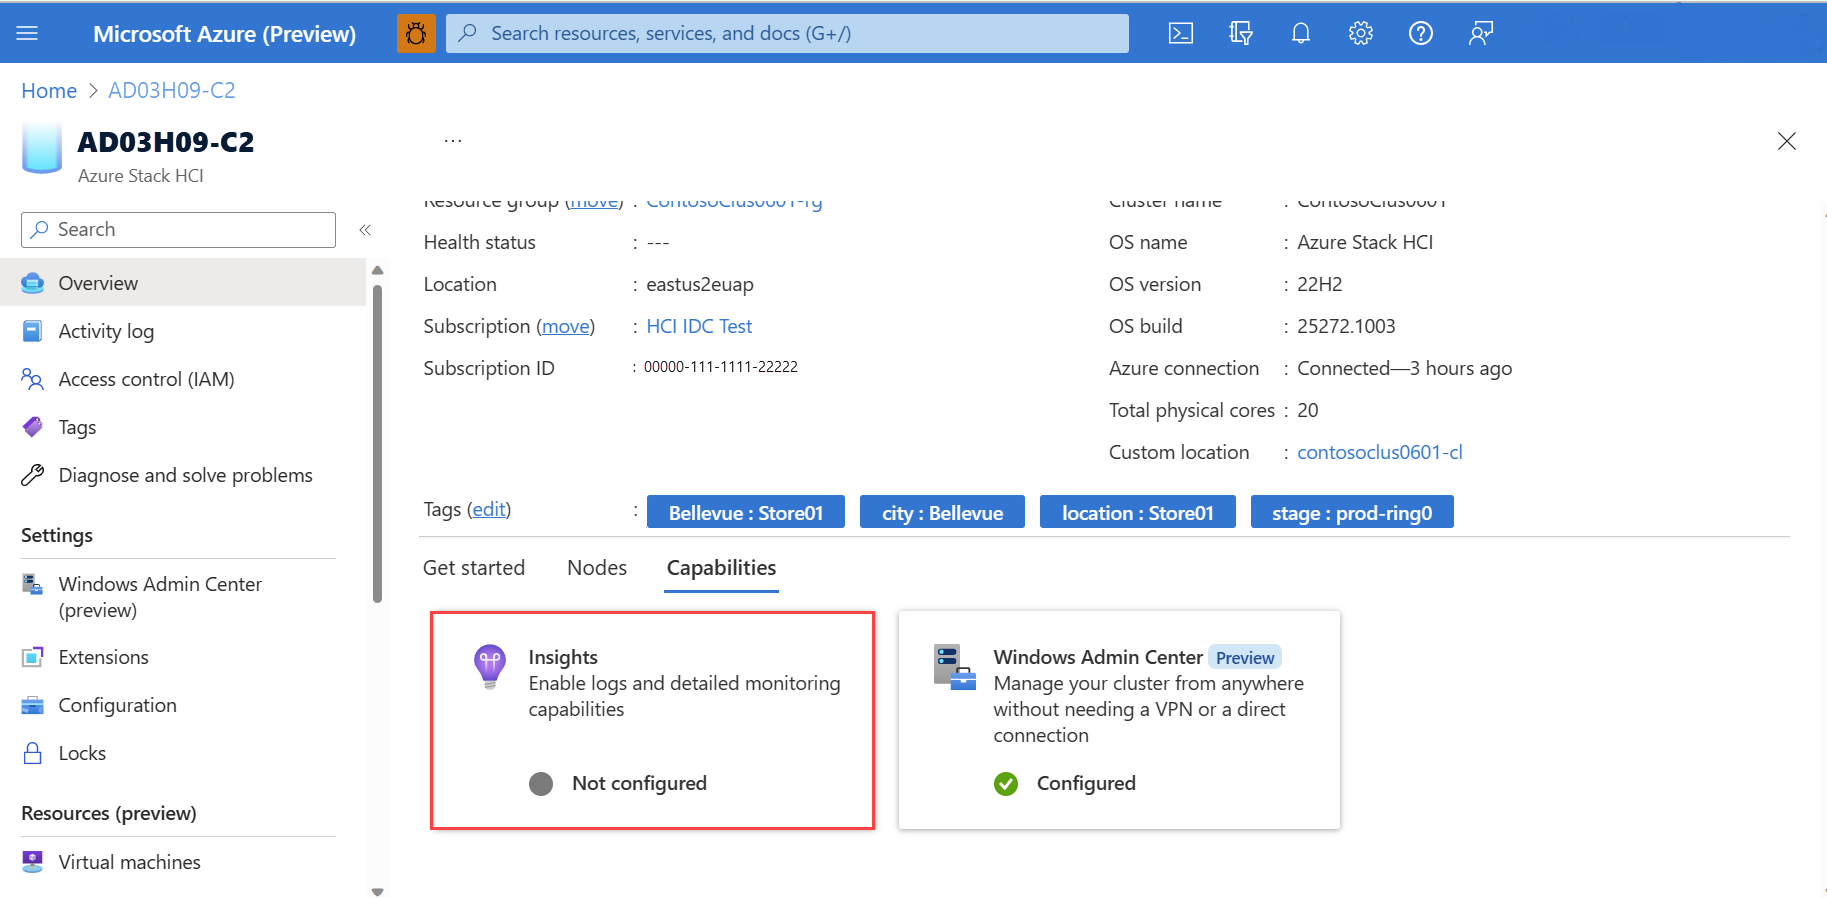
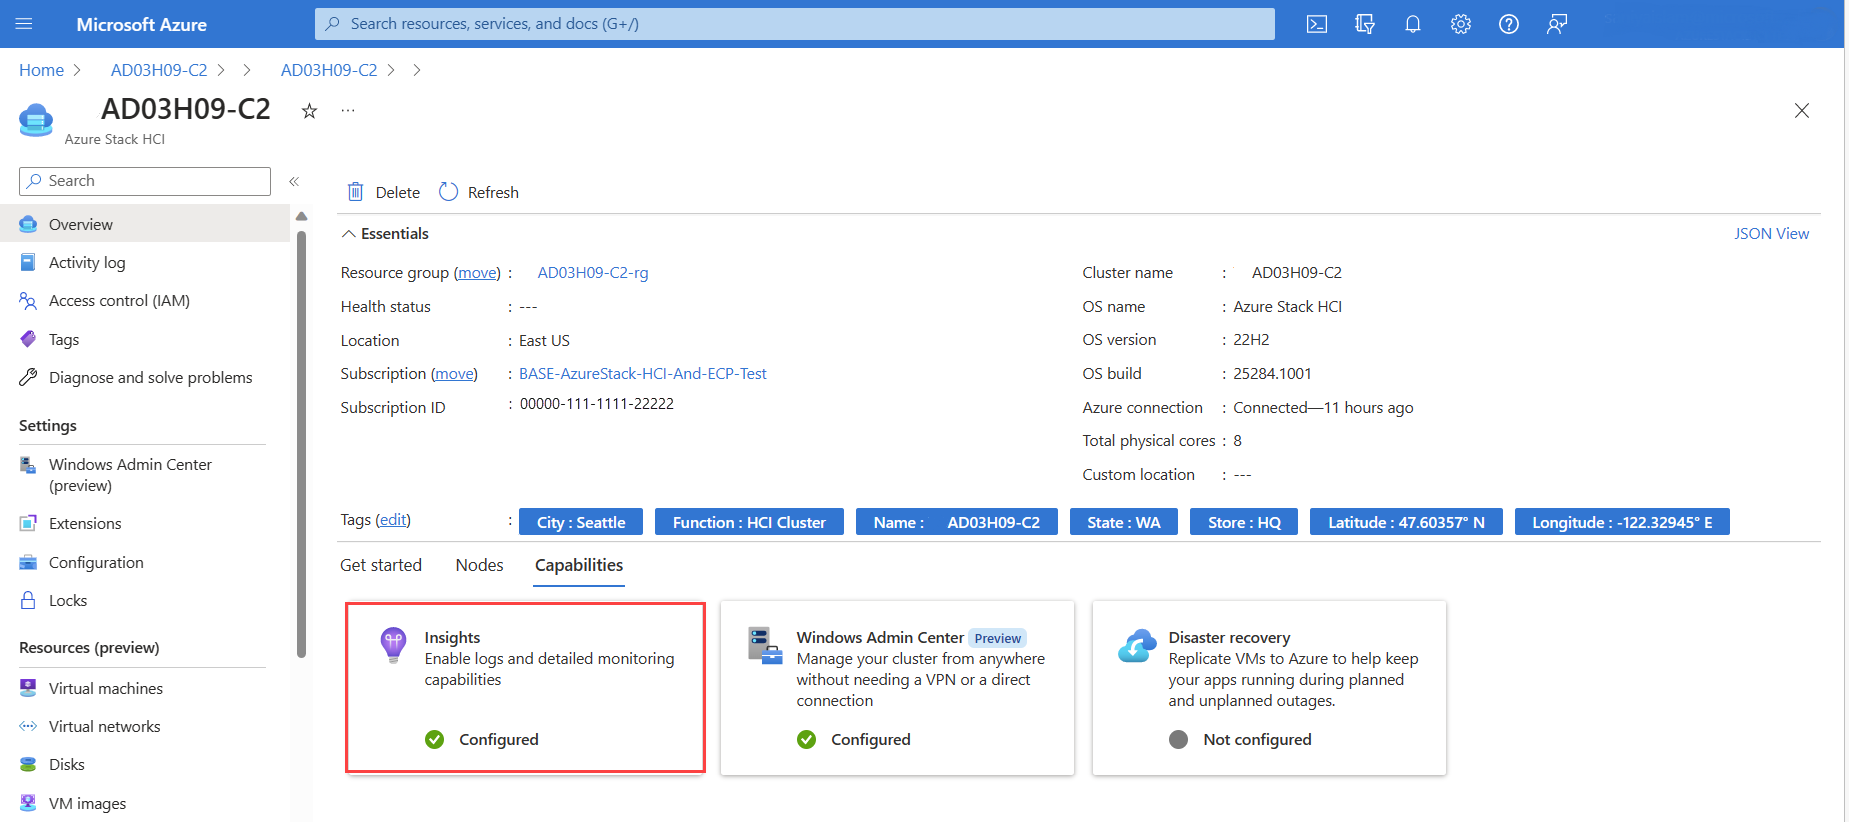
In the Azure portal, browse to your Azure Stack HCI cluster resource page, then select your cluster. Under the Capabilities tab, select Insights.
On the Insights page, select Get Started.

Note
The Get Started button is available only for Azure Stack HCI, version 22H2 with the May 2023 cumulative update or later installed and only after the managed identity is enabled. Otherwise, this button is disabled.
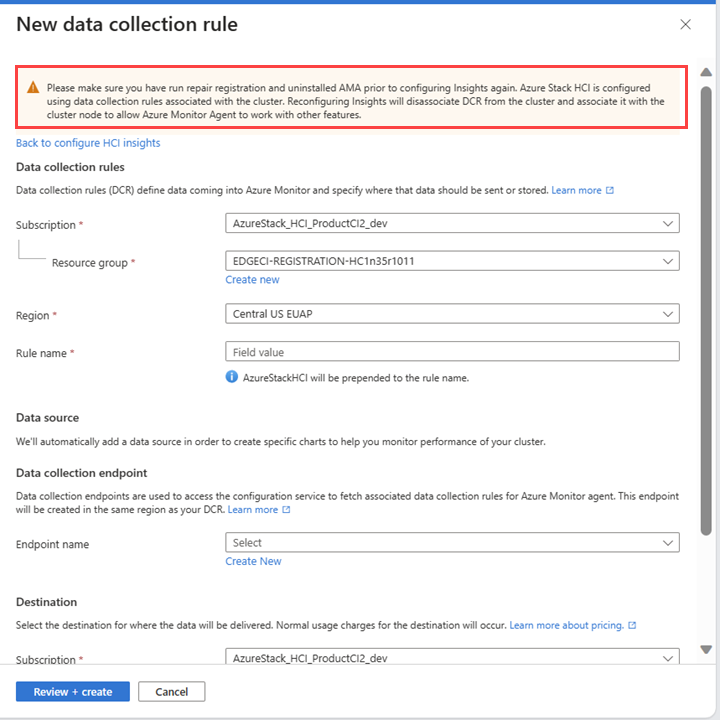
On the Insights configuration page, select an existing DCR from the Data collection rule dropdown. The DCR specifies the event logs and performance counters that need to be collected and stores it in a Log Analytics workspace. Insights creates a default DCR if one doesn't already exist. Only the DCRs that are enabled for Insights are included.
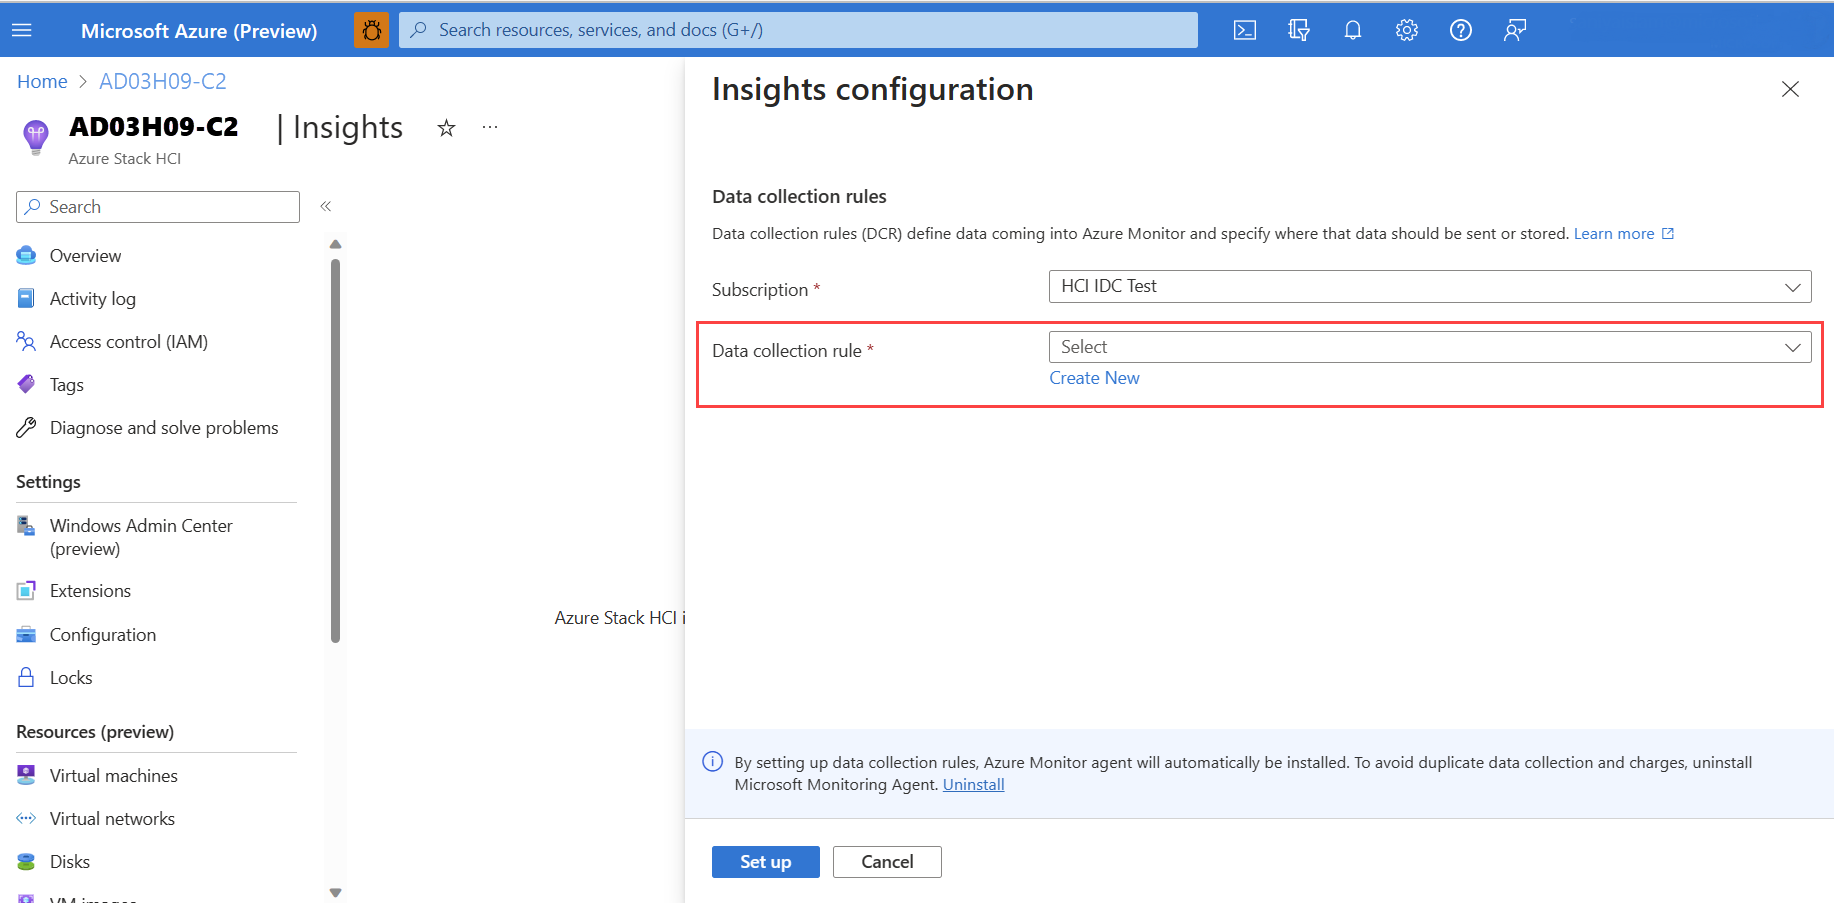
(Optional) You can also create a new DCR by selecting Create New on the Insights configuration page.
Important
We strongly recommend that you don't create your own DCR. The DCR created by Insights includes a special data stream required for its operation. You can edit this DCR to collect more data, such as Windows and Syslog events. The DCRs created through AMA installation will have a prefix
AzureStackHCI-attached with the DCR name.On the New data collection rule page, specify the subscription, DCR name, and data collection endpoint (DCE) name. DCEs are used to access the configuration service to fetch associated DCRs for Azure Monitor Agent. For more information about DCE, see Data collection endpoints in Azure Monitor.
Note
If you're using private links on the agent, you must add DCEs. For more information about AMA network settings, see Define Azure Monitor Agent network settings.
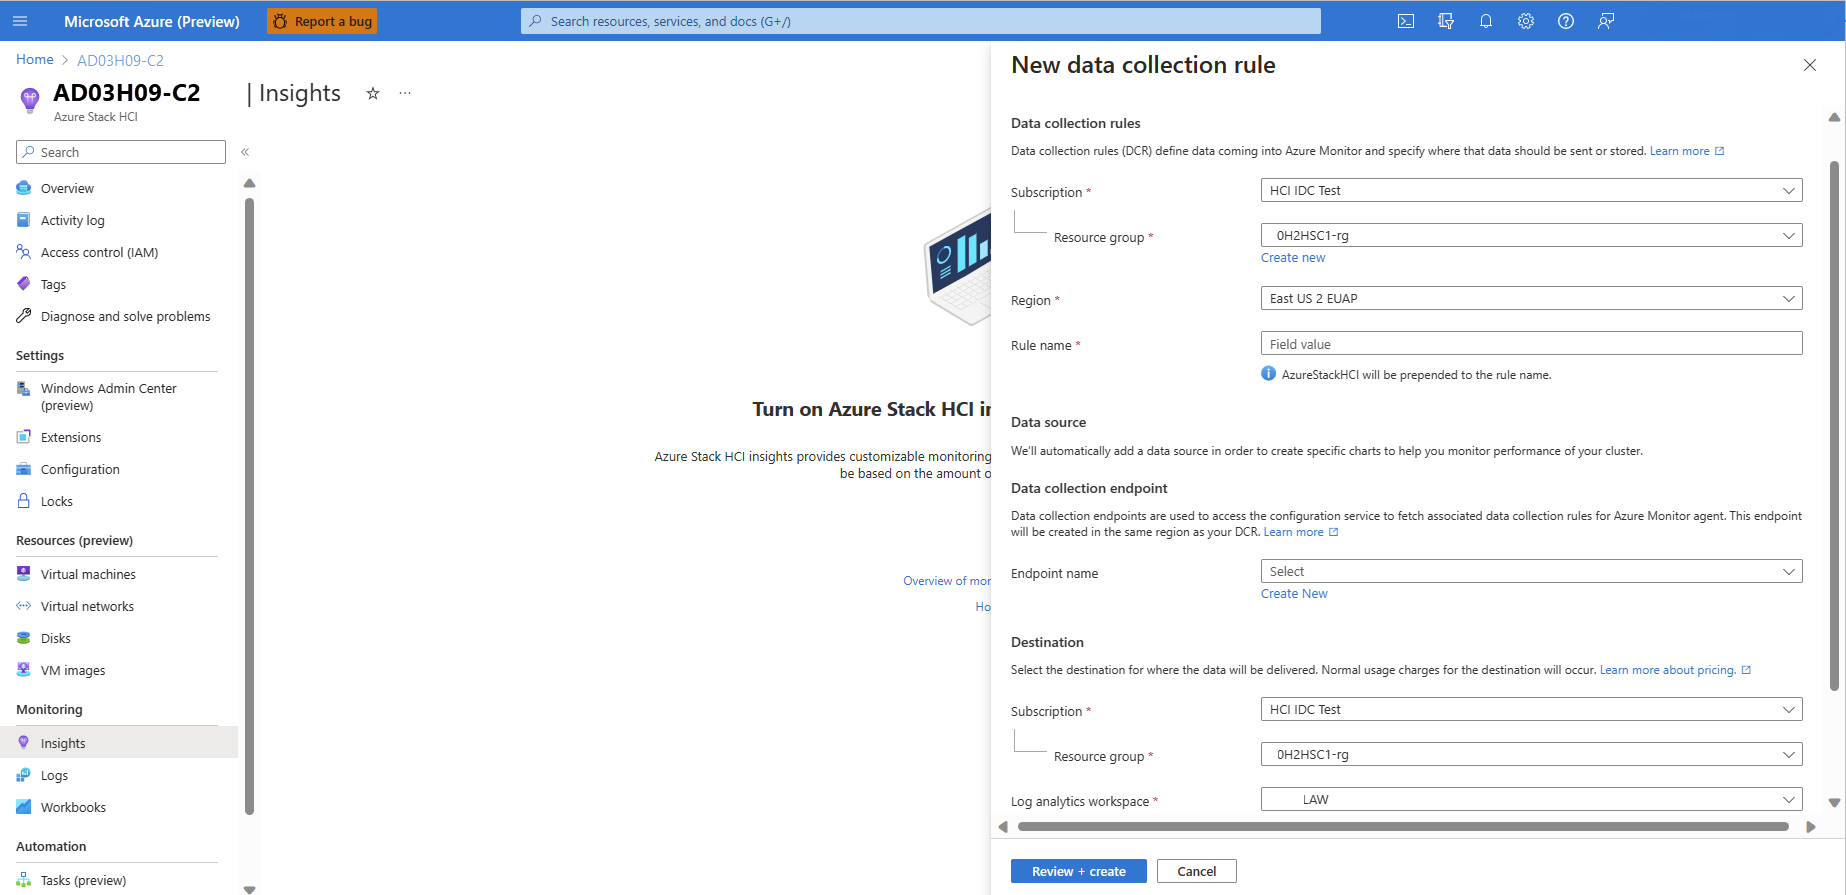
Select the Review + create button.
If a DCR isn't already created for the unmonitored cluster, then one is created with performance counters enabled and the Windows event log channel enabled.
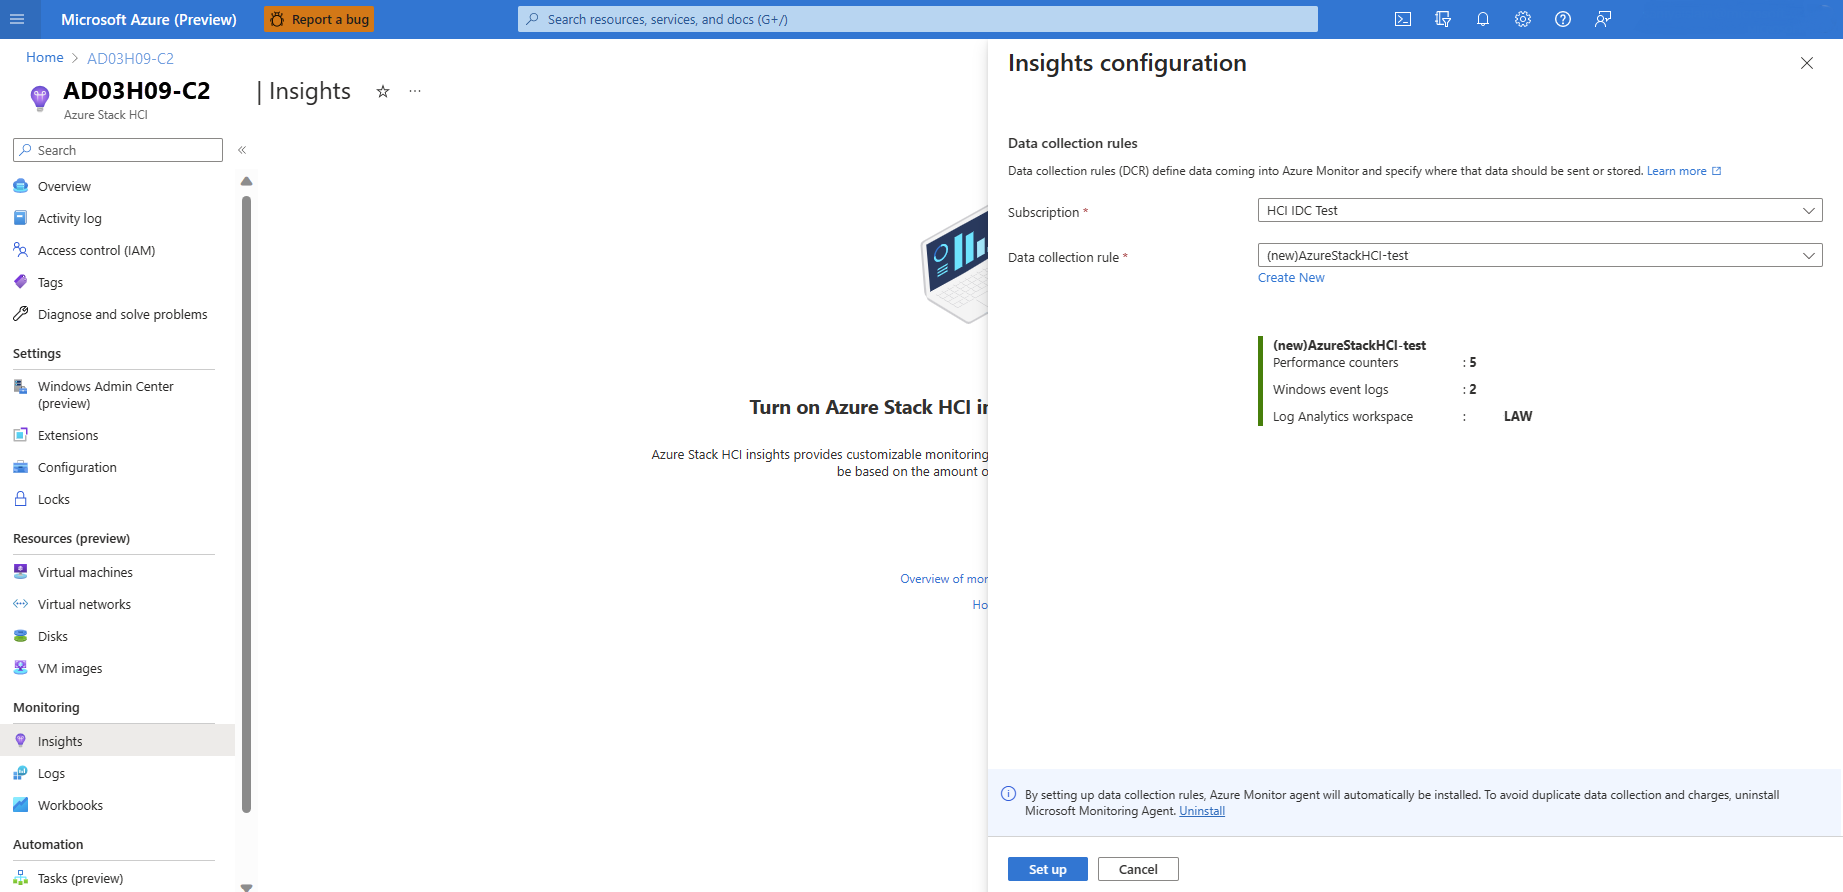
Review the final screen with a summary of DCR name, number of event logs, performance counters, and name of the Log Analytics workspace in which data is stored. Select Set up.
After selecting Set up, you're redirected to the Extensions page, where you can see the status of your agent installation. By configuring Insights, AMA is automatically installed on all nodes of the cluster.
Go to your Azure Stack HCI cluster resource page, and then select your cluster. Insights now shows as Configured on the Capabilities tab:


Data collection rules
When you enable Insights on a machine with the Azure Monitor Agent, you must specify a DCR to use. For more information about DCRs, see Data collection rules in Azure Monitor.
| Option | Description |
|---|---|
| Performance Counters | Specifies what data performance counters to collect from the operating system. This option is required for all computers. These performance counters are used to populate the visualizations in the Insights workbook. Currently, Insights workbook uses five performance counters - Memory()\Available Bytes, Network Interface()\Bytes Total/sec, Processor(_Total)\% Processor Time, RDMA Activity()\RDMA Inbound Bytes/sec, and RDMA Activity()\RDMA Outbound Bytes/sec |
| Event Log Channel | Specifies which Windows event logs to collect from the operating system. This option is required for all computers. Windows event logs are used to populate the visualizations in the Insights workbook. Currently, data is collected through two Windows event log channels: - microsoft-windows-health/operational and microsoft-windows-sddc-management/operational |
| Log Analytics workspace | Workspace to store the data. Only workspaces with Insights are listed. |
Event channel
The Microsoft-windows-sddc-management/operational and Microsoft-windows-health/operational Windows event channel is added to your Log Analytics workspace under Windows event logs.

By collecting these logs, Insights shows the health status of the individual servers, drives, volumes, and VMs. By default, five performance counters are added.
Performance counters
By default, five performance counters are added:

The following table describes the performance counters that are monitored:
| Performance counters | Description |
|---|---|
| Memory(*)\Available Bytes | Available Bytes is the amount of physical memory, in bytes, immediately available for allocation to a process or for system use. |
| Network Interface(*)\Bytes Total/sec | The rate at which bytes are sent and received over each network adapter, including framing characters. Bytes Total/sec is a sum of Bytes Received/sec and Bytes Sent/sec. |
| Processor(_Total)% Processor Time | The percentage of elapsed time that all of process threads used the processor to execution instructions. |
| RDMA Activity(*)\RDMA Inbound Bytes/sec | Rate of data received over RDMA by the network adapter per second. |
| RDMA Activity(*)\RDMA Outbound Bytes/sec | Rate of data sent over RDMA by the network adapter per second. |
After you enable Insights, it can take up to 15 minutes to collect the data. When the process is finished, you are able to see a rich visualization of the health of your cluster from the Insights menu on the left pane:

Disable Insights
To disable Insights, follow these steps:
Select Insights under the Capabilities tab.
Select Disable Insights.
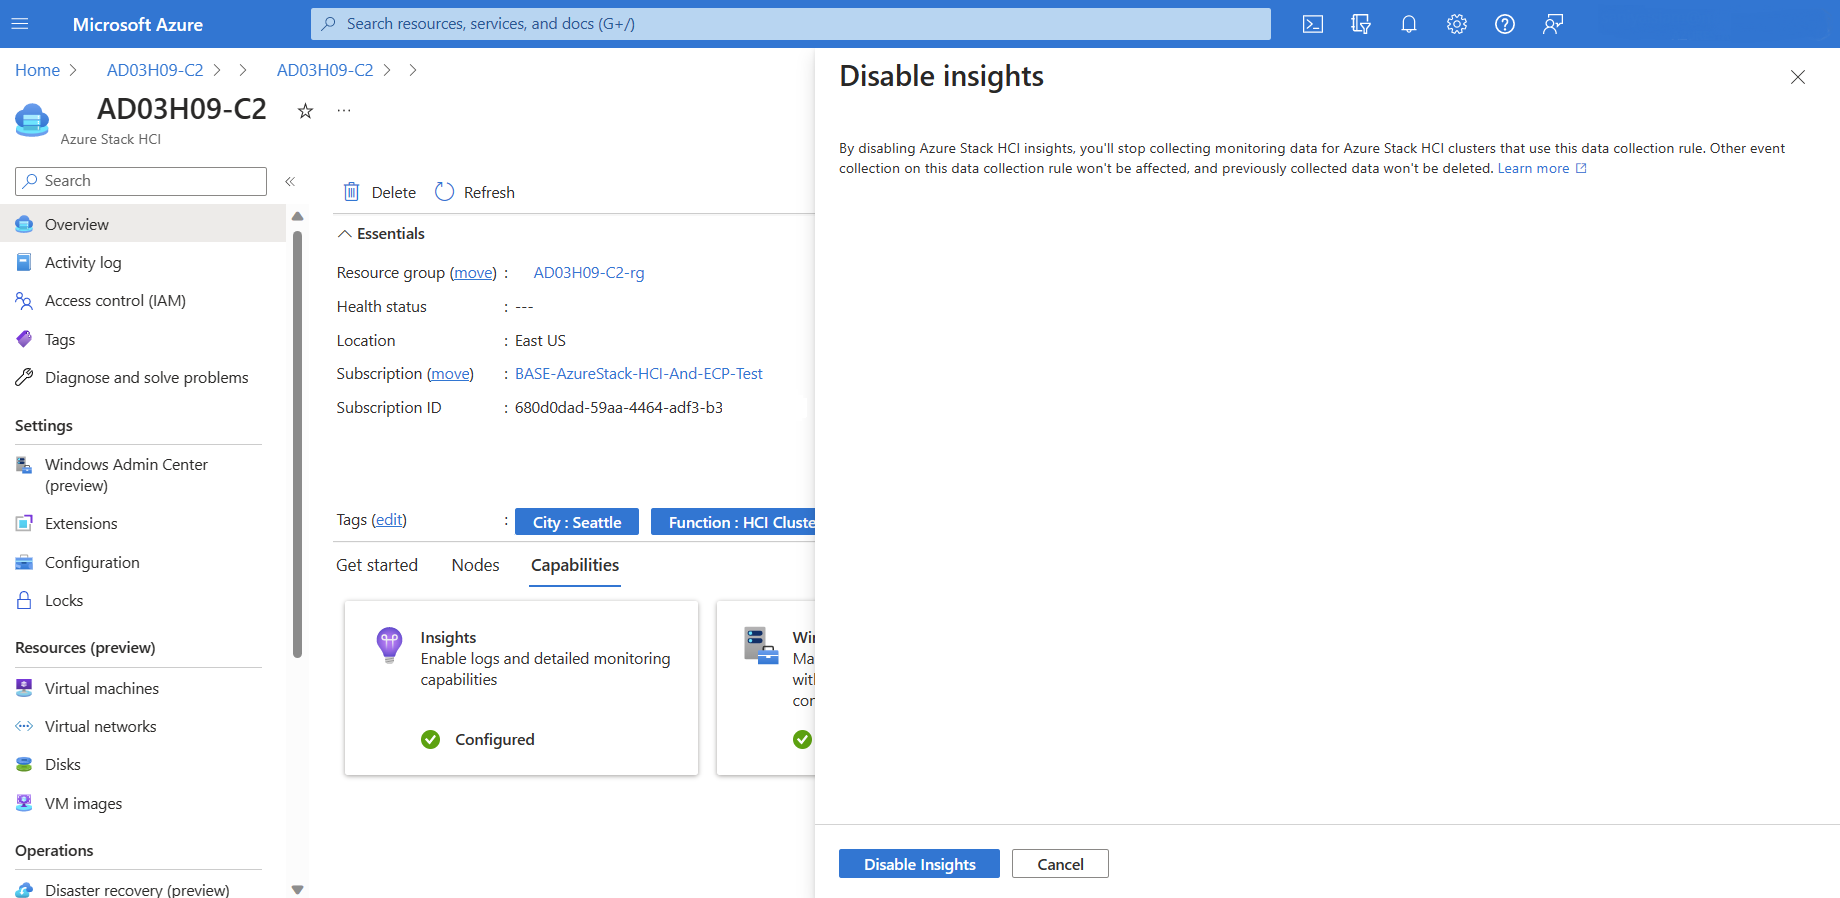

When you disable the Insights feature, the association between the data collection rule and the cluster is deleted and the Health Service and SDDC Management logs are no longer collected; however, existing data isn't deleted. If you'd like to delete that data, go into your DCR and Log Analytics workspace and delete the data manually.
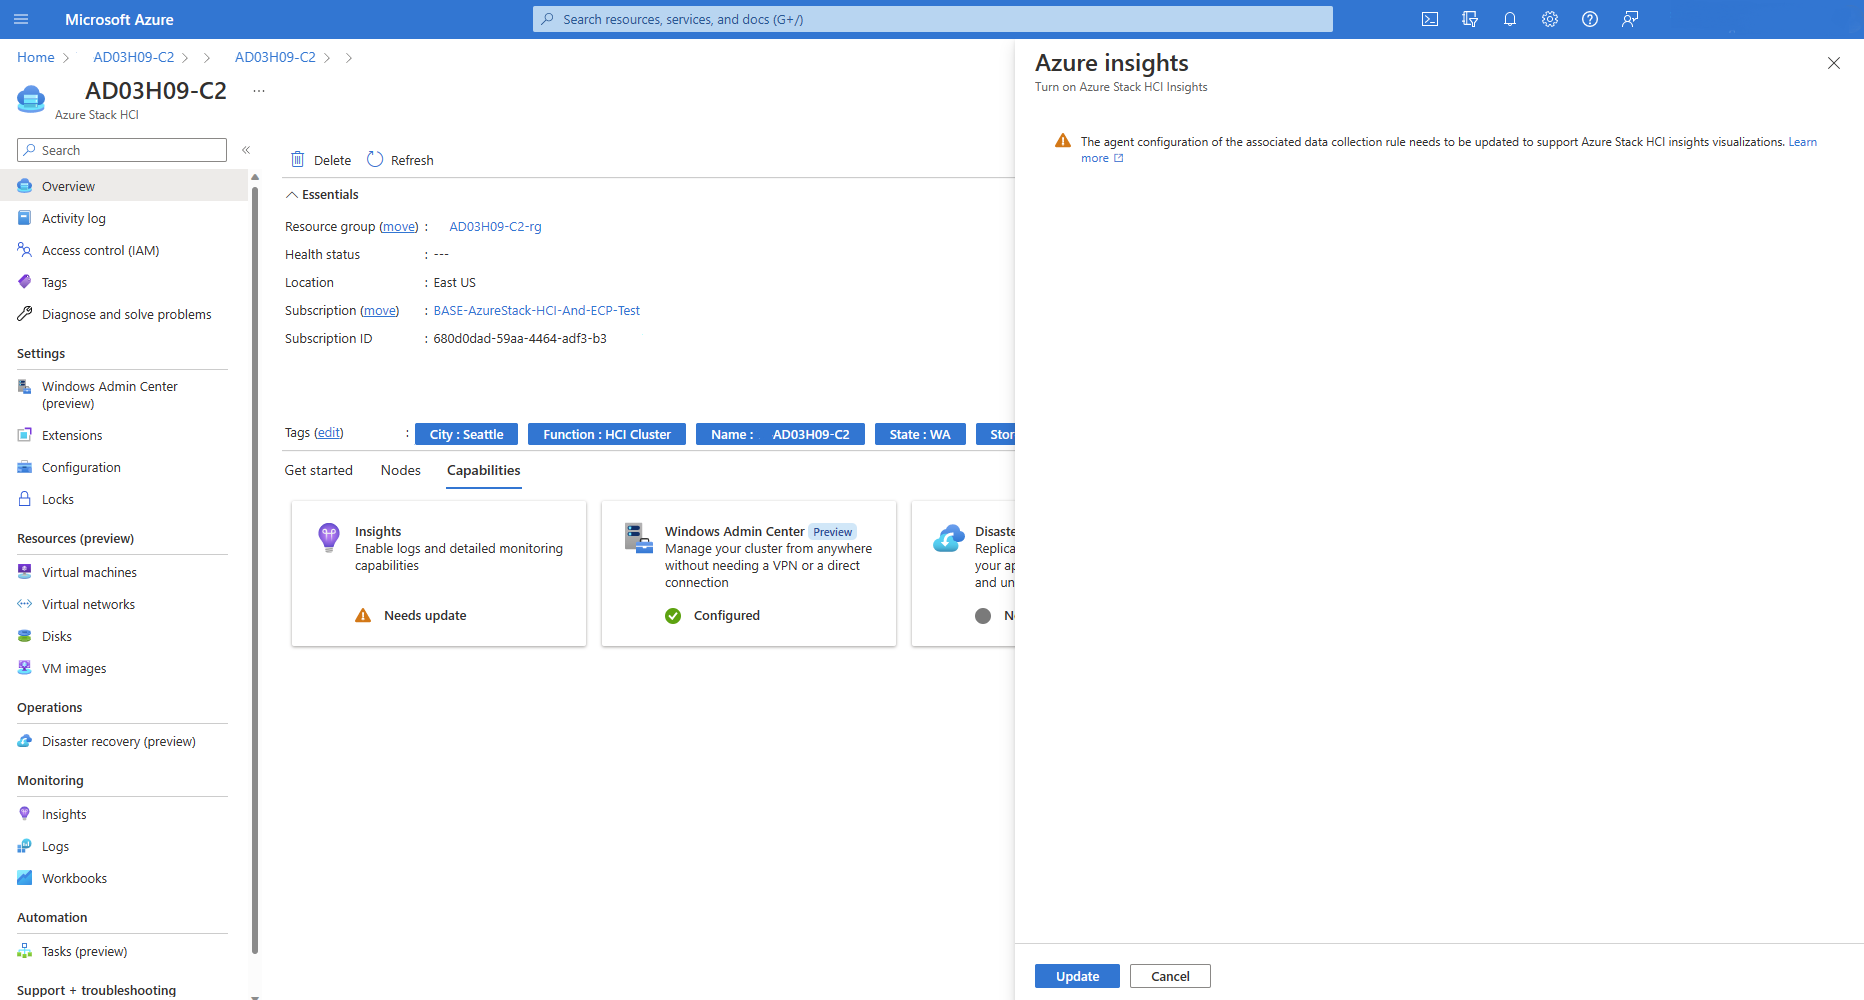
Update Insights
The Insights tile shows a Needs update message in the following cases:
- A data collection rule is changed.
- A health event from the Windows events log is deleted.
- Any of the five performance counters from the Log Analytics workspace are deleted.
To enable Insights again, follow these steps:
Select the Insights tile under Capabilities.
Select Update to see the visualizations again.

Migrate from the Microsoft Monitoring Agent
To migrate from the Microsoft Monitoring Agent (MMA) to the Azure Monitoring Agent (AMA), scroll down to Insights.

Select Install AMA; the Insights configuration window opens.

Select or create a data collection rule as described previously in the Enable Insights section.


The Azure Monitor Agent and the Microsoft Monitoring Agent extension can both be installed on the same computer during migration. Running both agents might lead to duplication of data and increased cost. If a machine has both agents installed, you see a warning in the Azure portal that you might be collecting duplicate data, as shown in the following screenshot.
Warning
Collecting duplicate data from a single machine with both the Azure Monitor Agent and the Microsoft Monitoring Agent extension can result in extra ingestion cost from sending duplicate data to the Log Analytics workspace.

You must remove the Microsoft Monitoring Agent extension yourself from any computers that are using it. Before you do this step, ensure that the computer isn't relying on any other solutions that require the Microsoft Monitoring Agent. After you verify that MicrosoftMonitoringAgent isn't still connected to your Log Analytics workspace, you can remove MicrosoftMonitoringAgent manually by redirecting to the Extensions page.

Troubleshoot
This section gives guidance for resolving the issues with using Insights for Azure Stack HCI.
Troubleshoot clusters registered before November 2023
Issue. In clusters that are registered before November 2023, features that use AMA on Azure Stack HCI, such as Arc for Servers, VM Insights, Container Insights, Defender for Cloud, and Sentinel might not collect logs and event data properly.
Cause. Before November 2023, the cluster registration configured AMA to use cluster identity, while the services that use AMA on Azure Stack HCI required the cluster node's identity for proper log collection. This mismatch resulted in improper collection of logs from these services.
Solution. To address this issue, we made a change in the HCI cluster registration for AMA to use the server identity instead. To implement this change, perform the following steps on clusters that are registered before November 2023:
- Repair cluster registration. See Repair cluster registration.
- Repair AMA. See Repair AMA.
- Reconfigure Insights for Azure Stack HCI. See Reconfigure Insights for Azure Stack HCI.
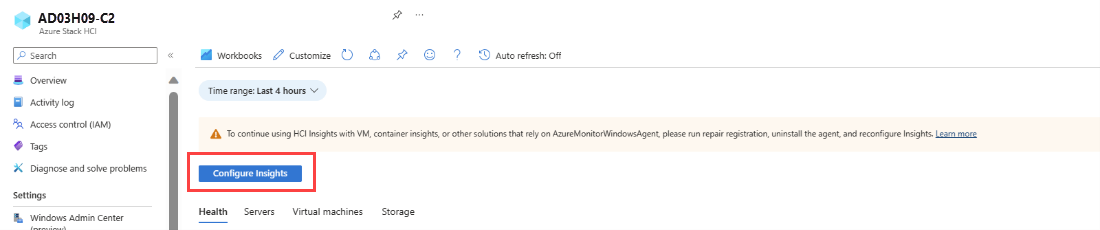
In the Azure portal, the Insights for Azure Stack HCI page automatically detects the change in the AMA configuration and displays a banner at the top of the page, guiding you to take necessary actions to continue using services that rely on AMA.

Repair cluster registration
Follow these steps to repair cluster registration:
On your cluster nodes, install the latest
Az.StackHCIPowerShell module. Replacelatestversionwith the latestAz.StackHCIversion number.Install-Module -Name Az.StackHCI -RequiredVersion {latestversion} -Scope CurrentUser -Repository PSGallery -ForceRun the repair registration command to remove regkey:
Register-AzStackHCI -TenantId {TenantID} -SubscriptionId {subscriptionID} -ComputerName {NodeName} -RepairRegistration
Repair AMA for Azure Stack HCI
Choose one of the following options to repair AMA:
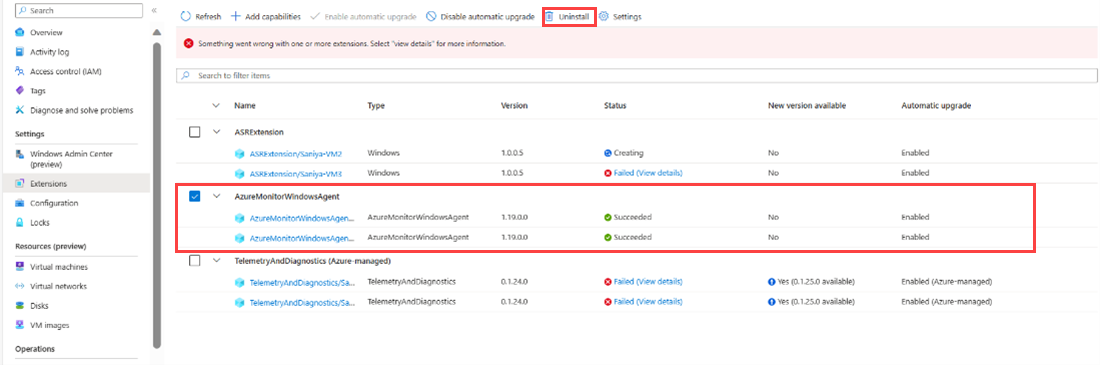
Option 1: Uninstall AMA
If AMA is already updated, uninstall it. Follow these steps to uninstall AMA:
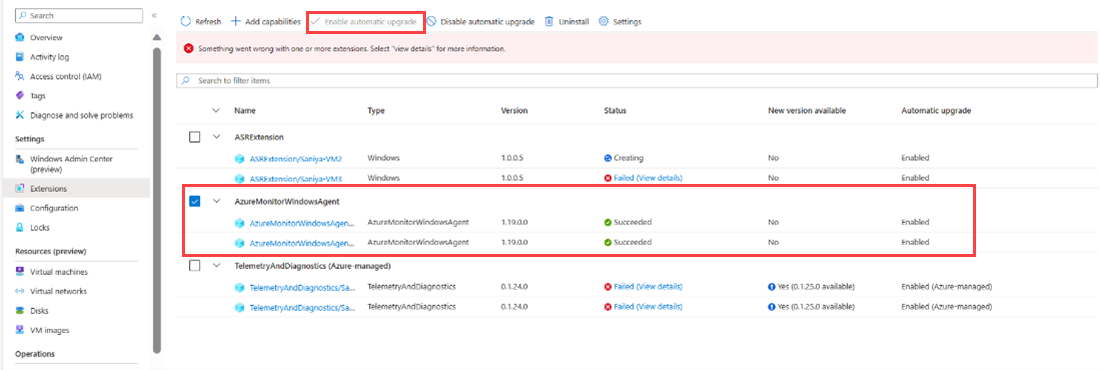
In the Azure portal, go to the Extensions page for your Azure Stack HCI cluster.
Select the checkbox for AzureMonitorWindowsAgent and select Uninstall.
Option 2: Update AMA
Follow these steps to update AMA:
In the Azure portal, go to the Extensions page for your Azure Stack HCI cluster.
Select the checkbox for AzureMonitorWindowsAgent and select Enable automatic upgrade, if not done already.
Option 3: Restart AMA
Follow these steps on all the cluster nodes to restart AMA:
Run the following command to disable AMA:
cd C:\Packages\Plugins\Microsoft.Azure.Monitor.AzureMonitorWindowsAgent\<agent version number>
AzureMonitorAgentExtension.exe disable
After the executable completes and all the AMA processes stop, run the following command to restart the agent:
AzureMonitorAgentExtension.exe enable
Option 4: Reboot your cluster nodes


Reconfigure Insights for Azure Stack HCI
Follow these steps to reconfigure Insights for Azure Stack HCI:
In the Azure portal, the Insights page for your Azure Stack HCI cluster displays a banner at the top, as shown in the following screenshot, which helps you configure Insights again and associate DCR with the cluster nodes. Review the banner and select Configure Insights.
Reconfigure DCR. Follow the instructions to configure Insights as provided in this article. See Configure Insights for Azure Stack HCI.


Troubleshoot blank Workbooks page with no data populated
Issue. You see a blank Workbooks page with no data populated, as shown in the following screenshot:

Possible causes. There might be several possible causes for this issue, including recent configuration of Insights, incomplete troubleshooting steps for clusters registered before November 2023, or associated DCR not being configured properly.
Solution. To troubleshoot the issue, perform the following steps in sequence:
- If you recently configured Insights, wait for up to one hour for AMA to gather data.
- If there's still no data after waiting, make sure you have completed all the steps mentioned in the Troubleshoot clusters registered before November 2023 section.
- Verify the configuration of the associated DCR. Make sure that event channels and performance counters are added as data sources to the associated DCR, as described in the Data Collection Rules section.
- If the issue persists after performing the above steps, and you still don't see any data, contact customer support for assistance.
For more detailed troubleshooting guidance, see Troubleshooting guidance for the Azure Monitor Agent.


Insights visualizations
Once Insights is enabled, the following tables provide details about all resources.
Health
Provides health faults on a cluster.
| Metric | Description | Unit | Example |
|---|---|---|---|
| Fault | A short description of health faults. On clicking the link, a side panel opens with more information. | No unit | PoolCapacityThresholdExceeded |
| Faulting resource type | The type of resource that encountered a fault. | No unit | StoragePool |
| Faulting resource ID | Unique ID for the resource that encountered a health fault. | Unique ID | {1245340c-780b-4afc-af3c-f9bdc4b12f8a}: SP:{c57f23d1-d784-4a42-8b59-4edd8e70e830} |
| Severity | Severity of fault could be warning or critical. | No unit | Warning |
| Initial fault time | Timestamp of when server was last updated. | Datetime | 4/9/2022, 12:15:42 PM |
Server
| Metric | Description | Unit | Example |
|---|---|---|---|
| Servers | The names of the servers in the cluster. | No unit | VM-1 |
| Last updated | The date and time of when the server was last updated. | Datetime | 4/9/2022, 12:15:42 PM |
| Status | The health of server resources in the cluster. | It can be healthy, warning, critical, and other | Healthy |
| CPU usage | The % of time the process has used the CPU. | Percent | 56% |
| Memory usage | Memory usage of the server process is equal to counter Process\Private Bytes plus the size of memory-mapped data. | Percent | 16% |
| Logical processors | The number of logical processors. | Count | 2 |
| CPUs | The number of CPUs. | Count | 2 |
| Uptime | The time during which a machine, especially a computer, is in operation. | Timespan | 2.609 hr. |
| Site | The name of the site to which the server belongs. | Site name | SiteA |
| Domain name | The local domain to which the server belongs. | No unit | Contoso.local |
Virtual machines
Provides the state of all the virtual machines in the cluster. A VM can be in one of the following states: Running, Stopped, Failed, or Other (Unknown, Starting, Snapshotting, Saving, Stopping, Pausing, Resuming, Paused, Suspended).
| Metric | Description | Unit | Example |
|---|---|---|---|
| Servers | The name of the server. | No unit | Sample-VM-1 |
| Last Updated | This gives the date and time of when the server was last updated | Datetime | 4/9/2022, 12:24:02 PM |
| Total VMs | The number of VMs in a server node. | Count | 0 of 0 running |
| Running | The number of VMs running in a server node. | Count | 2 |
| Stopped | The number of VMs stopped in a server node. | Count | 3 |
| Failed | The number of VMs failed in a server node. | Count | 2 |
| Other | If VM is in one of the following states (Unknown, Starting, Snapshotting, Saving, Stopping, Pausing, Resuming, Paused, Suspended), it's considered as "Other." | Count | 2 |
Storage
The following table provides the health of volumes and drives in the cluster:
| Metric | Description | Unit | Example |
|---|---|---|---|
| Volumes | The name of the volume | No unit | ClusterPerformanceHistory |
| Last updated | The date and time of when the storage was last updated. | Datetime | 4/14/2022, 2:58:55 PM |
| Status | The status of the volume. | Healthy, warning, critical, and other. | Healthy |
| Total capacity | The total capacity of the device in bytes during the reporting period. | Bytes | 2.5 GB |
| Available capacity | The available capacity in bytes during the reporting period. | Bytes | 20B |
| Iops | Input/output operations per second. | Per second | 45/s |
| Throughput | Number of bytes per second the Application Gateway has served. | Bytes per second | 5B/s |
| Latency | The time it takes for the I/O request to be completed. | Second | 0.0016 s |
| Resiliency | The capacity to recover from failures. Maximizes data availability. | No unit | Three Way Mirror |
| Deduplication | The process of reducing the physical number of bytes of data that needs to be stored on disk. | Available or not | Yes/No |
| File system | The type of filesystem. | No unit | ReFS |
Azure Monitor pricing
When you enable monitoring visualization, logs are collected from:
- Health Management (Microsoft-windows-health/operational).
- SDDC Management (Microsoft-Windows-SDDC-Management/Operational; Event ID: 3000, 3001, 3002, 3003, 3004).
You're billed based on the amount of data ingested and the data retention settings of your Log Analytics workspace.
Azure Monitor has pay-as-you-go pricing, and the first 5 GB per billing account per month is free. Because pricing can vary due to multiple factors, such as the region of Azure you're using, visit the Azure Monitor pricing calculator for the most up-to-date pricing calculations.
Next steps
Feedback
Coming soon: Throughout 2024 we will be phasing out GitHub Issues as the feedback mechanism for content and replacing it with a new feedback system. For more information see: https://aka.ms/ContentUserFeedback.
Submit and view feedback for