Set up log alerts for Azure Stack HCI
Applies to: Azure Stack HCI, versions 23H2 and 22H2
This article describes how to set up log alerts for Azure Stack HCI systems: using Insights for Azure Stack HCI and using pre-existing sample log queries, such as average server CPU, available memory, available volume capacity, and more.
For information about how to set up metric alerts, see Set up metric alerts for Azure Stack HCI.
Prerequisites
Before you begin, make sure that the following prerequisites are completed:
- You have access to an Azure Stack HCI cluster that is deployed and registered.
- You must have Insights enabled on the cluster. Enabling Insights configures the cluster to collect required logs in a Log Analytics workspace.
Set up log alerts using Insights
Important
Using Insights isn't recommended for high severity alerts. It could take 15 minutes to collect logs.
Follow these steps to set up log alerts using Insights. Ensure that you have reviewed and completed the prerequisites.
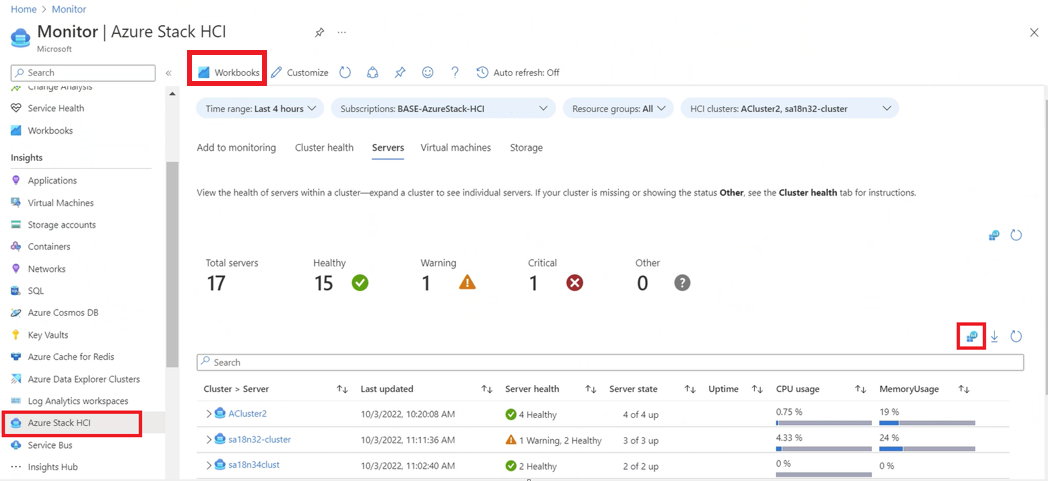
From the Azure portal, navigate to or search for Monitor and select Azure Stack HCI.
Select one of the tabs to view the health of your resources. For example, select Servers to view the health of servers in your cluster.
Customize the workbook and edit it until you see a blue Logs view icon. Select the icon to view and edit your query.
After the query loads, select + New alert rule.

From the alerts interface you can set up your alert conditions, actions, and more. For more information, see Log query results and Alert actions and details.


Set up alerts using sample log queries
You can start monitoring your Azure Stack HCI system and setting up alerts for it by using pre-existing log queries available in the Azure portal. These queries can help you check and monitor the health of your system.
Follow these steps to set up log alerts using sample log queries. Ensure that you have reviewed and completed the prerequisites.
In the Azure portal, browse to your Azure Stack HCI cluster resource page, then select the cluster you want to monitor using sample log queries.
On your cluster Overview page, select JSON View.
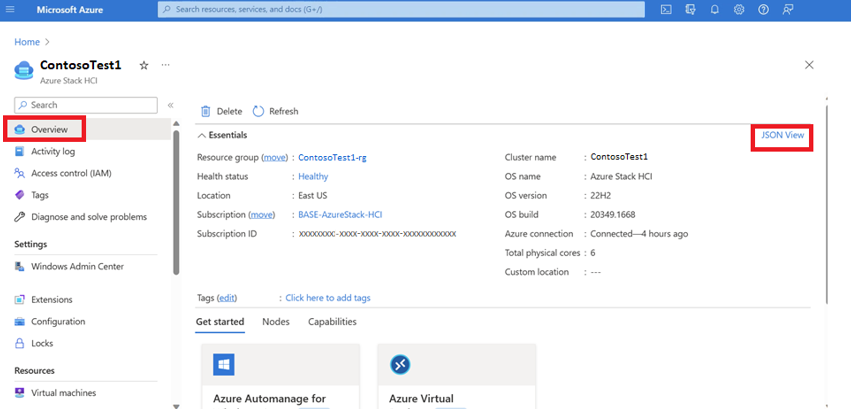
Copy the ClusterArmId detail from the Resource ID box.

From the Azure portal, navigate to or search for Monitor and select Logs.
Select + Add filter to add a filter for Resource type.
Choose Azure Stack HCI for a populated list of Azure Stack HCI system sample logs.

Select Load to Editor to open the query workspace.
Set the scope to Log analytics workspace for logs linked to the cluster resource.
Paste your ClusterArmId detail in the
where ClusterArmId =~section of the query to see results related to your cluster.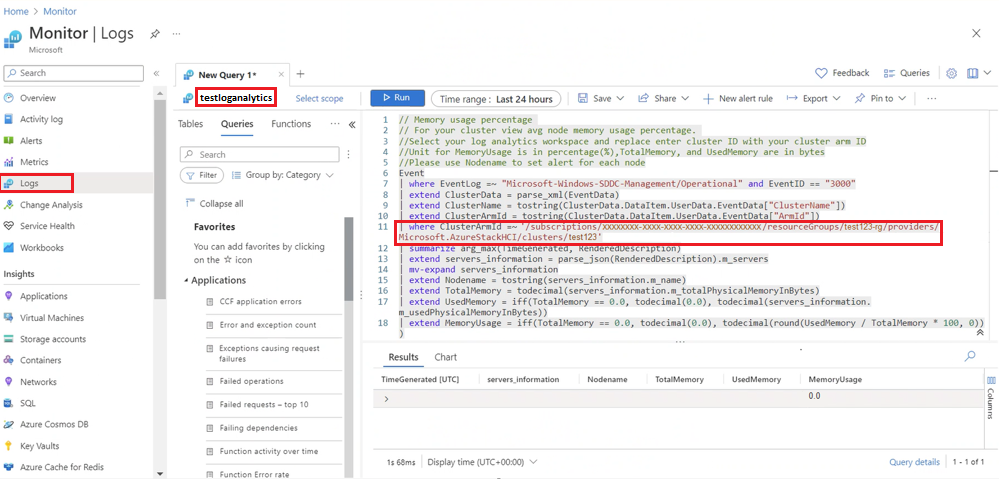
Select Run.


After the information appears, you can examine the logs and create alerts based on the results. For more information, see Log query results and Alert actions and details.
Set up alerts for multiple clusters
To set a new or change an existing query to accommodate multiple clusters ClusterArmId's, add the | where ClusterArmId in~ clause to your query. Include the ClusterArmId's for each of the clusters you want to use in your query. For example, | where ClusterArmId in~ ('ClusterArmId1', 'ClusterArmId2', 'ClusterArmId3')

Log query results
After adding logs, you should confirm that you get the expected results by running your query against the workspace that stores your cluster logs. If you don't get the expected results, correct your log query and rerun it.
When creating a new alert rule, you must set conditional details to summarize your query results. These details are based on three categories: measurement, split by dimensions, and alert logic. In your alert details, fill in the following components:
- Measure: The value used to set up alerts. By default, it takes only numerical values. Convert your values to integer and select the correct one from the dropdown list.
- Aggregation type: Ensures you receive an alert, even if only one cluster memory value meets what you have specified. For alerts on multiple clusters, you need to put the aggregation type as a maximum and not an average or total.
- Resource ID column: Splits the alert measure value based on other values. To get alerts on a cluster, use the
clusterarmIDor to set up alerts for the server, use_resourceID. Check your value names in your log query for accuracy. - Dimension name: Splits an alert measure further. For example, to get alerts per server, select the
Nodename.- When you set up alerts, you might not see all the values in the dropdown menu. Select the checkbox for Include all future values to ensure you set up the same alert on multiple servers in the cluster.
- Threshold value: Provides a notification based on the value you've set.
In this example, when the measure value Memoryusageint with an aggregation type of maximum reaches the threshold of 15 minutes, you get an alert.

Once your details are set, you can review your conditions for alert accuracy.

Alert actions and details
To determine how you receive notifications for your cluster alerts, use the Actions tab as shown in the image. You can create new action groups or set an alert rule for existing ones. You can choose to receive notifications through email, Event Hubs, and more.

Once you have set your actions, the Details tab allows you to set the alert severity, name, description, and region. Select Review + Create for a final review of all your alert settings and to create your alert.

After your alerts are set up, you can monitor your alert rules, action groups, and more in the Alerts tab.

Log collection frequency
By default, logs are generated every hour. To check how often your logs are collected, use the following PowerShell command:
get-clusterresource "sddc management" | get-clusterparameter
To change the frequency of log generation on your local machine, change the CacheDumpIntervalInSeconds log collection parameter.
Here's an example of the log frequency set for every 15 minutes.
get-clusterresource "sddc management" | set-clusterparameter -name "CacheDumpIntervalInSeconds" -value 900
Note
To collect all logs don't lower the frequency to less than 15 minutes.
Next steps
Learn how to Create Azure Monitor alert rules.
Feedback
Coming soon: Throughout 2024 we will be phasing out GitHub Issues as the feedback mechanism for content and replacing it with a new feedback system. For more information see: https://aka.ms/ContentUserFeedback.
Submit and view feedback for